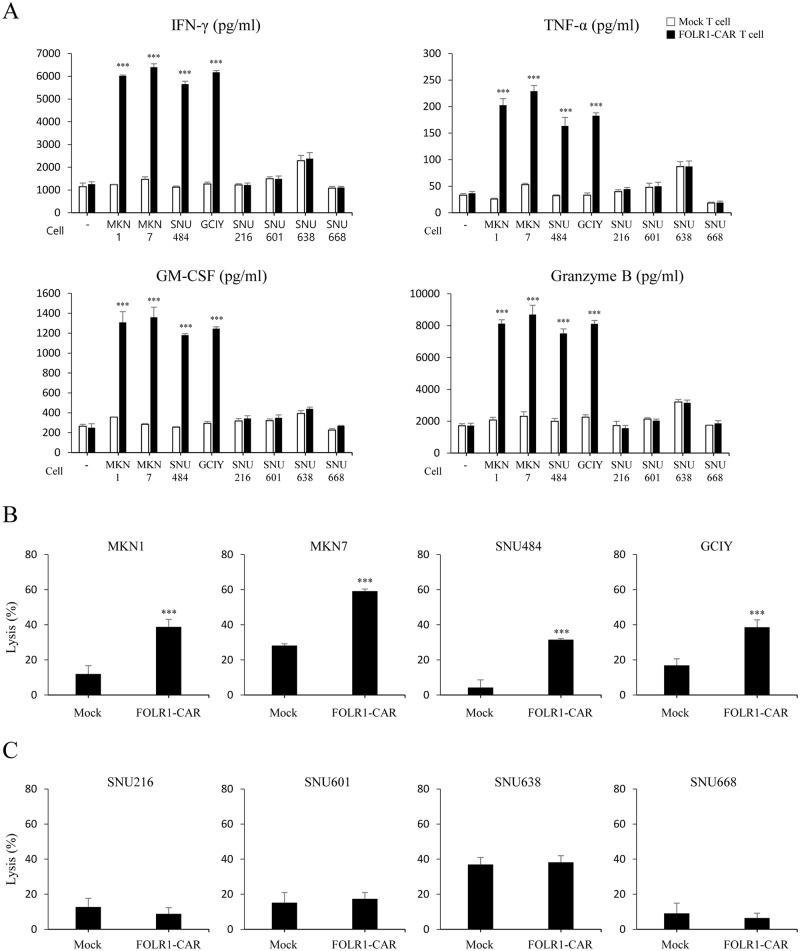
Fig 7. Specific response of FOLR1-CAR T cells against FOLR1-positive GC cells.
T cells were co-cultured with FOLR1-positive GC cells (MKN1, MKN7, SNU484, and GCIY) or FOLR1-negative GC cells (SNU216, SNU601, SNU638, and SNU668) at an E/T ratio of 10:1 for 4 h. (A) The cytokine levels, including IFN-r, TNF-a, GM-CSF, and granzyme B were evaluated by ELISA. (B-C) The specific cytotoxicity of FOLR1-CAR T cells against FOLR1-positive GC cells (B) or FOLR1-negative GC cells (C) were measured by luciferase assay. Experiments were repeated three times with similar results. The data are represented as the mean cytokine concentrations ± SD (pg/ml) and rate of lysis ± SD (%) from triplicate cultures. Statistical analysis was performed using the two-sided unpaired t-test and data were compared with mock T cells. (***P<0.001).

