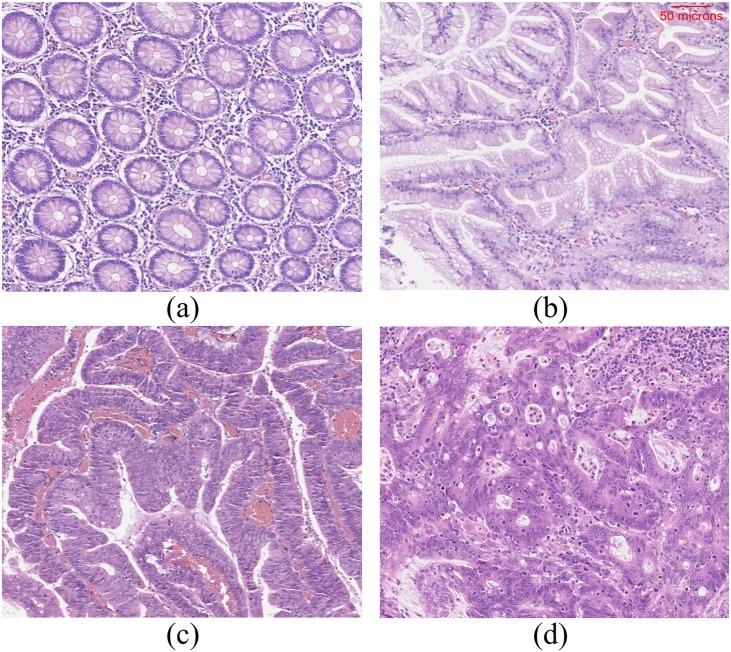
Fig 1. Example images of haematoxylin and eosin stained normal tissue and tissues with different abnormalities.
(a) Normal tissue, (b) Hyperplastic polyp, (c) Tubular adenoma with low-grade dysplasia and (d) carcinoma. The scale bar shown on (b) is same for all the other sub-images. Note that these images are acquired using a different imaging system and are presented here to illustrate the tissue structure of different classes.

