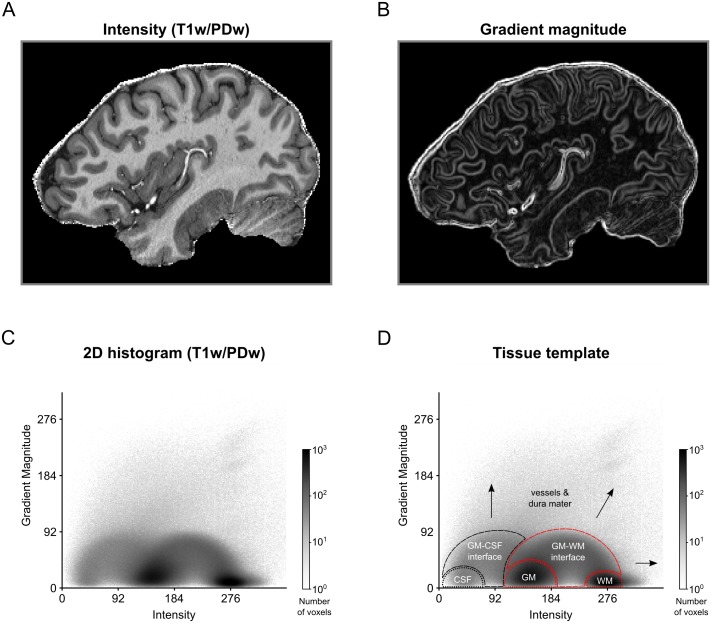
Fig 1. 2D histogram representation for MRI image of a human brain.
(A) Intensity and (B) gradient magnitude values of a brain extracted T1w-divided-by-PDw MRI image are represented in a (C) 2D histogram. Darker regions in the histogram indicate that many voxels in the MRI image are characterized by this particular combination of image intensity and gradient magnitude. (D) The 2D histogram displays a characteristic pattern with tissue types occupying particular areas of the histogram. Voxels containing CSF, dura mater or blood vessels (black dashed lines and arrows) cover different regions of the histogram than voxels containing WM and GM (red dashed lines). As a result, brain tissue becomes separable from non-brain tissue.

