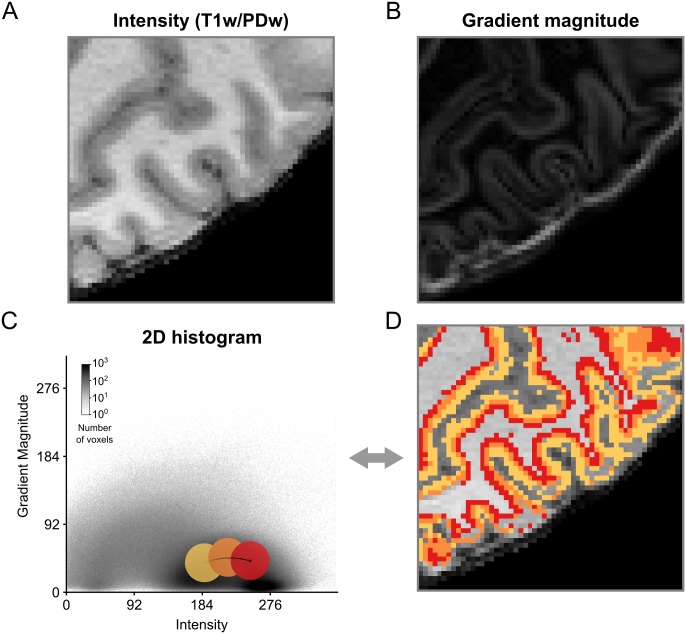
Fig 2. Creation of 2D transfer functions with pre-defined shapes.
(A) Intensity and (B) gradient magnitude values of of a brain extracted T1w-divided-by-PDw MRI image are represented in a 2D histogram. By moving widgets of pre-defined shape, e.g. a circle, over the (C) 2D histogram and (D) concurrent visualization of selected voxels on a 2D slice of brain, positions of different tissue types in the 2D histogram can be probed and transfer functions can be created. In this example, the different probe positions (yellow, orange and red circles) appear to contain different aspects of GM.

