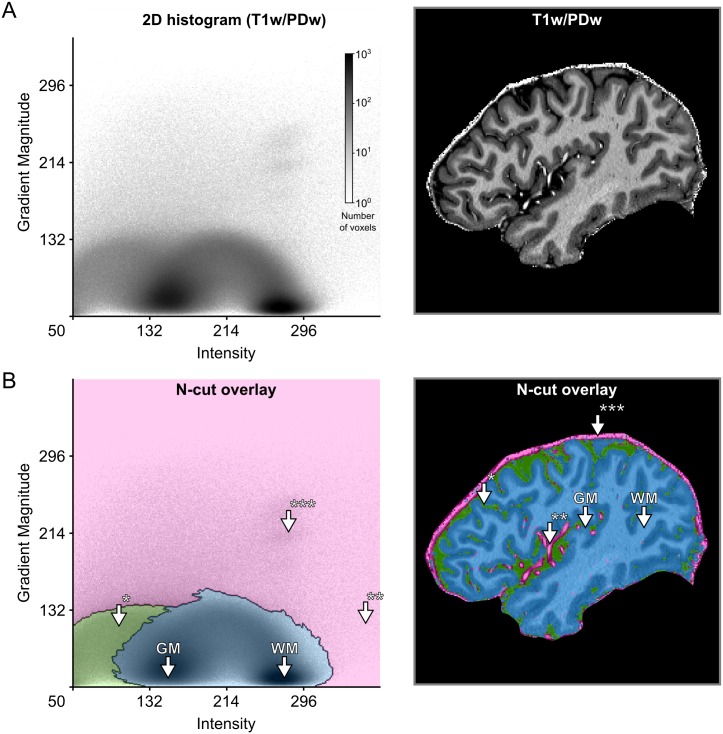
Fig 3. Creation of 2D transfer functions with data-driven shapes.
(A) The user starts with the 2D histogram representation of image intensity and gradient magnitude (left side) and concurrent visualization of the original brain data (right side). The user can then interact with and select data in the 2D histogram to specify transfer functions. In this example, this was done with the help of a normalized graph cut decision tree. (B) The interaction with the 2D histogram results in data-driven shapes of selected areas, here shaded in pink, green and blue (left side). Voxels selected by those areas are highlighted in corresponding colors against the backdrop of the original brain data (right side). The visualization reveals that the area of the 2D histogram shaded in blue selects brain voxels, while the areas shaded in green and pink select CSF* and blood vessel voxels**/dura mater***, respectively.

