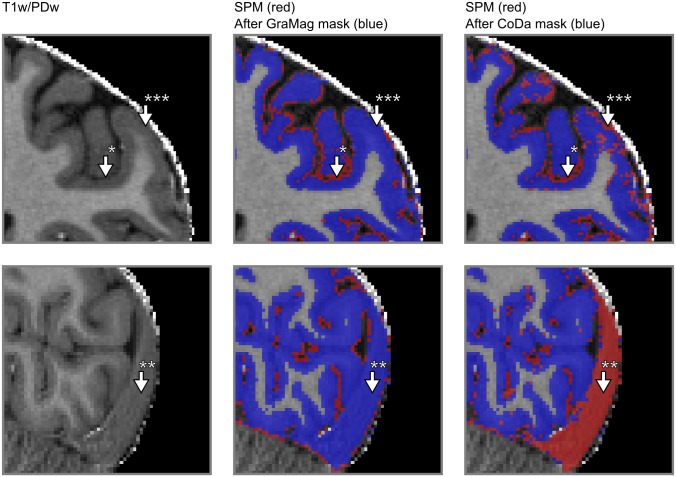
Fig 6. Comparison of GM segmentation results for MPRAGE data.
GM segmentation results are shown for one representative subject on a transverse (upper row) and a sagittal slice (lower row) of the brain before and after applying the GraMag and CoDa methods. The original image that is input to the segmentation is shown on the left. The original GM segmentation obtained from SPM 12 is shown in red (middle and right column). GM segmentations after additional polishing with brain mask obtained with either the GraMag (middle column) or the CoDa method (right column) are overlaid in blue. Additional masking removes blood vessels, CSF (arrow *) and most of dura mater (arrow †) voxels from the SPM GM definition. Because of its unique compositional properties, connective tissue from the sagittal sinus can be captured and excluded using the CoDa method (arrow **). An area badly affected by the CoDa mask is also indicated with arrow ***.

