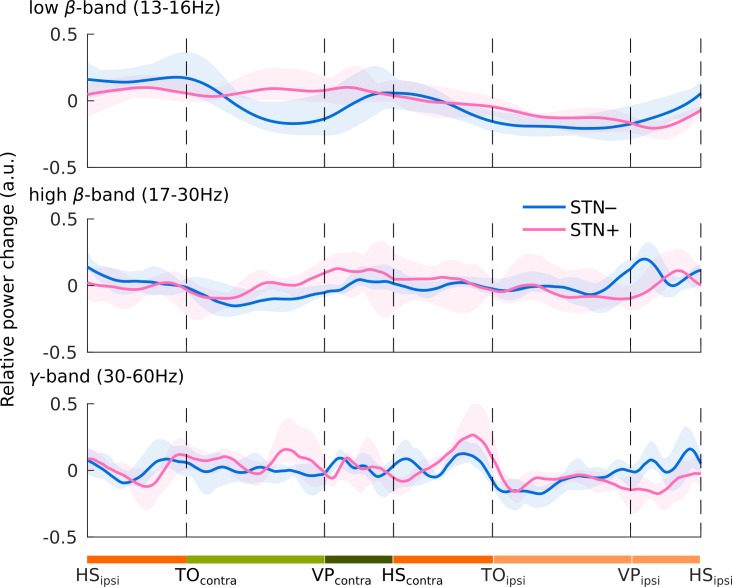
Fig 2. Modulation of the spectral power during the gait cycle.
Event related synchronization (ERS) and desynchronization (ERD) in low β- (top) high β- (middle) and γ-frequency band (bottom). Subthalamic power changes of the phases of gait are shown as the average relative change of the whole stride of all subjects. Shaded areas represent the confidence intervals (5–95%) of the group mean. We analyzed the power changes of STN–and STN+ during the gait cycle of the contralateral foot (but they could be also referred to the matched gait phases of the ipsilateral one). Stance is the period during which the foot is on the ground (dark and light orange bars). The stance phase includes a period of bilateral foot contact with the floor (double-support phases [dark orange bars]), and a period of unilateral foot contact (single-support phase [light orange bar]). The swing phase (light green and dark green bars) is the interval in which the foot is lifted from the floor. Thanks to the velocity peak (VP) of the marker placed on the lateral malleolus, we identified an acceleration (light green) a deceleration (dark green) sub-phase of the swing phase. HS = heel strike; TO = toe off; VP = velocity peak; lower case subscript indicates the foot contralateral (contra) or ipsilateral (ipsi) to STN–or STN+.

