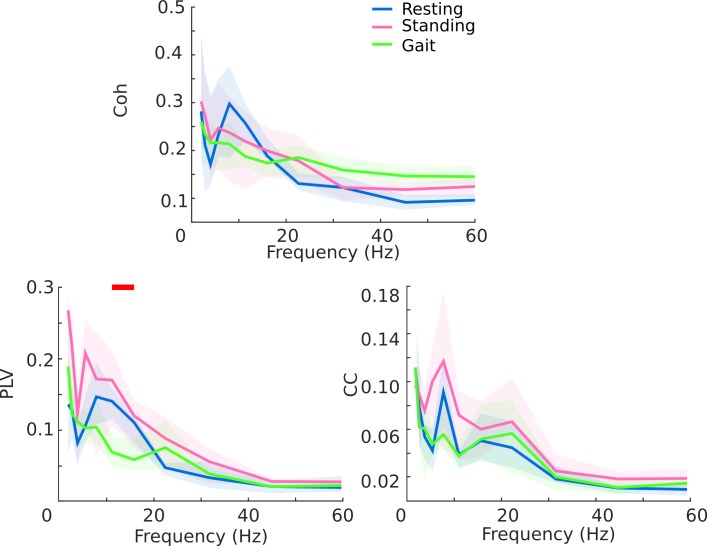
Fig 4. Inter-hemispheric coherence.
Inter-hemispheric coherence (Coh, top panel), phase locking value (PLV, bottom left plot) and amplitude cross-correlation (CC, bottom right plot) during resting state (blue line), upright standing (pink line) and walking (green line). Statistical significance (red bar, paired Wilcoxon test, p<0.05 uncorrected) was reached for the PLV selectively in the β-frequency band between resting state and walking. Shaded areas represent the confidence intervals (5–95%) of the group mean.

