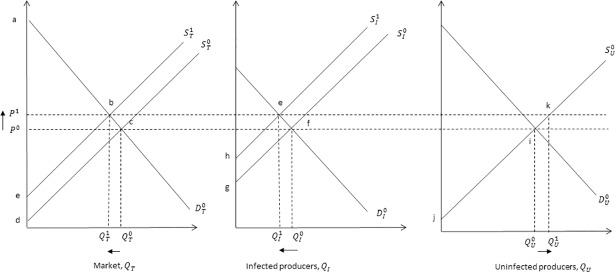
Fig 1. Demand and supply equilibrium associated with reduced milk production following an outbreak of Johne’s.
In Fig 1, the intersection of supply curves, , , and , and demand curve, , determine the initial equilibrium market price, P0, and quantity supplied by the market, , the infected producers, , and uninfected producers, . A decrease in milk production associated with the introduction of Johne’s shifts the infected producer supply curve backward to , the equilibrium quantity supplied by infected producers will decrease, from to , and the price increases, from P0 to P1. Uninfected producers will increase their supply from, to , in response to a price increase (i.e. a movement along their supply curve). Overall, the total market supply, QT = QU + QI, will decrease, from to , because .

