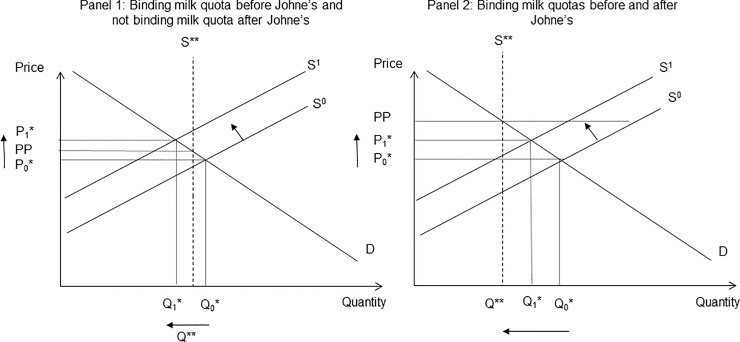
Fig 7. Demand and supply equilibrium associated with binding and non-binding milk quotas.
In Fig 7, the intersection of supply curves, S0, demand curve, D, and milk quota, S**, determine the initial equilibrium price, P0*, and quantity supplied by the market, Q0*. A decrease in milk production associated with Johne’s disease shifts the supply curve backward to S1. In panel 1 the milk quota is binding before Johne’s because Q0*> Q** (quantity associated with milk quota S**), but not binding after Johne’s because Q1* < Q**, the price increases from P0* to P1,* above producer price, PP. In the case of binding milk quotas (panel 2), the equilibrium quantity supplied is restricted to Q** creating a new supply curve (S**), because Q1* is above the binding milk quota, and fixed price, PP.

