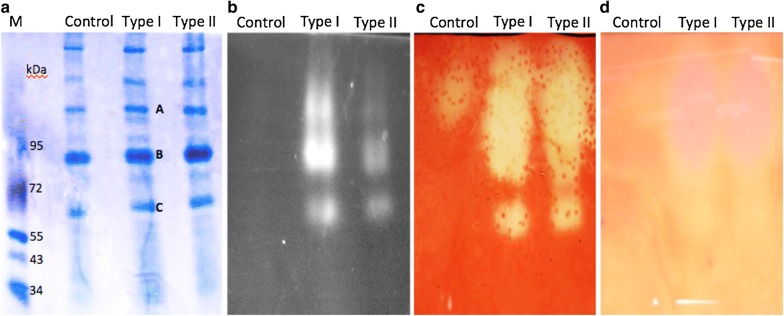
Fig. 3.
Zymogram analysis of cellulosomal complex. Zymogram analysis was conducted using the supernatants of the Type I, Type II, and Control strains. a A 5–15% native PAGE analysis stained with coomassie brilliant blue R-250. b Zymogram of total glucanase using MUC as substrate. c Zymogram of endoglucanase with dye-CMC as substrate. d Zymogram of xylanase using xylan as substrate

