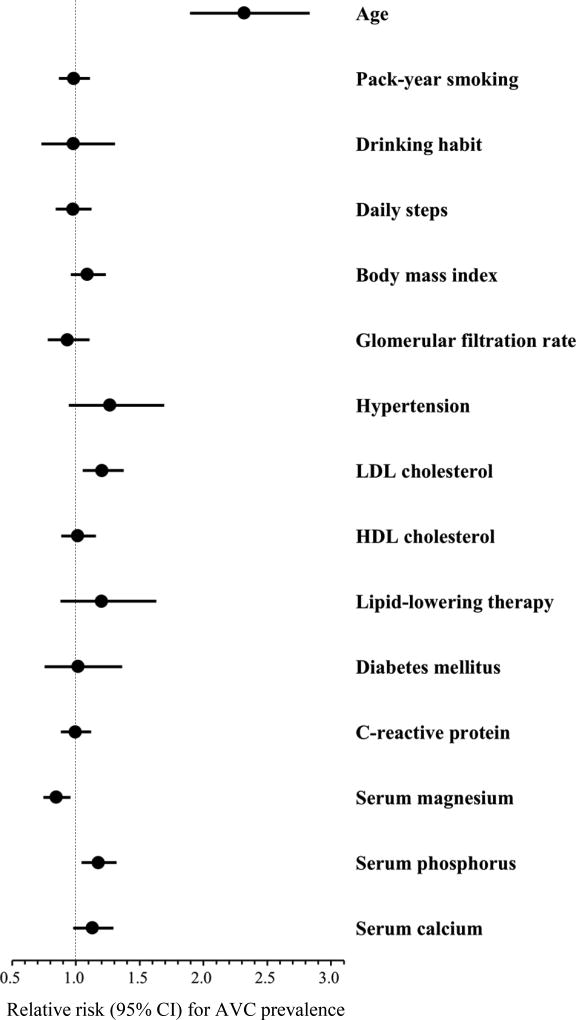
Figure 1. Association of demographics, behavioral and cardiovascular risk factors, and serum micronutrients with AVC prevalence.
Circle markers and horizontal lines indicate relative risks and 95% CI for AVC prevalence, respectively. Relative risks for continuous variables are expressed as per 1 standard deviation higher in values of each factor, with the following exception: pack-year smoking and C-reactive protein (per 1-log higher). All variables listed were mutually adjusted and further adjusted for computed tomography type. AVC, aortic valve calcification; CI, confidence interval; HDL, high-density lipoprotein; LDL, low-density lipoprotein.

