Figure 2.
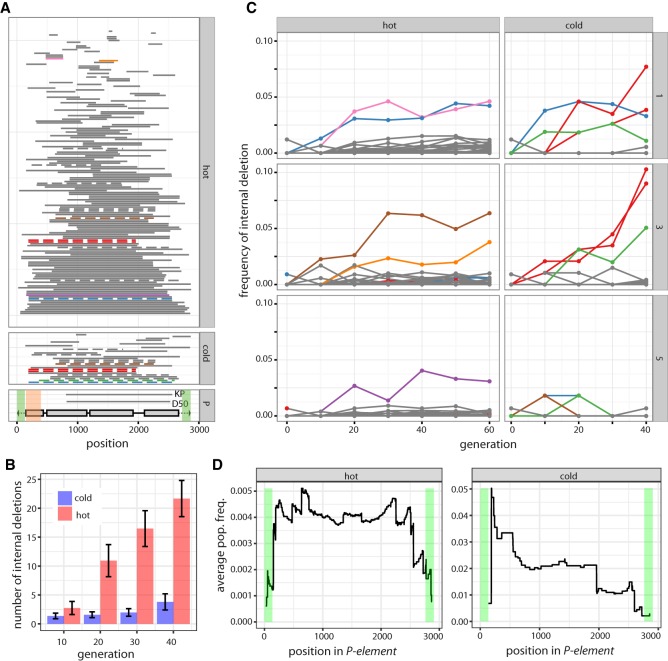
Dynamics of internally deleted P-elements during the invasion. (A) All internal deletions identified under hot and cold conditions are shown (sum over all replicates and generations). Horizontal bars represent the deleted sequence. Internal deletions that were probably present in the base population are shown in dashed lines, and internal deletions that increase in frequency (more than 3%) are indicated in color. The position of the two red internal deletions differs by a single nucleotide, so they likely refer to the same internal deletion. The lower panel shows the structure of the P-element, including the four ORFs (gray boxes) and the TIRs (black triangle). The position of two internal deletions with documented P-element repression (KP and D50) are indicated (Black et al. 1987; Ramussson et al. 1993). Regions required for mobilization of the P-element are shaded in green, and regions required for repressing P-element activity are shaded in orange (Majumdar and Rio 2015). (B) An unbiased comparison of the abundance of internally deleted P-elements between hot and cold conditions. The physical coverage of the P-element has been 100 times randomly sampled to 52. Internal deletions are consistently more frequent in hot-evolved populations. (C) Frequency of internally deleted P-elements during the hot and cold invasion for all three replicates (right panel). The color of the trajectories is as in panel A, allowing identification of the position (within the P-element) of internal deletions. (D) Fitness landscape of internally deleted P-elements: average population frequency of internal deletions covering a given site. A high average frequency indicates that deletion of a site is advantageous and leads, on average, to a frequency increase of an internally deleted P-element. Note that few internal deletions were observed under cold conditions.

