Figure 1.
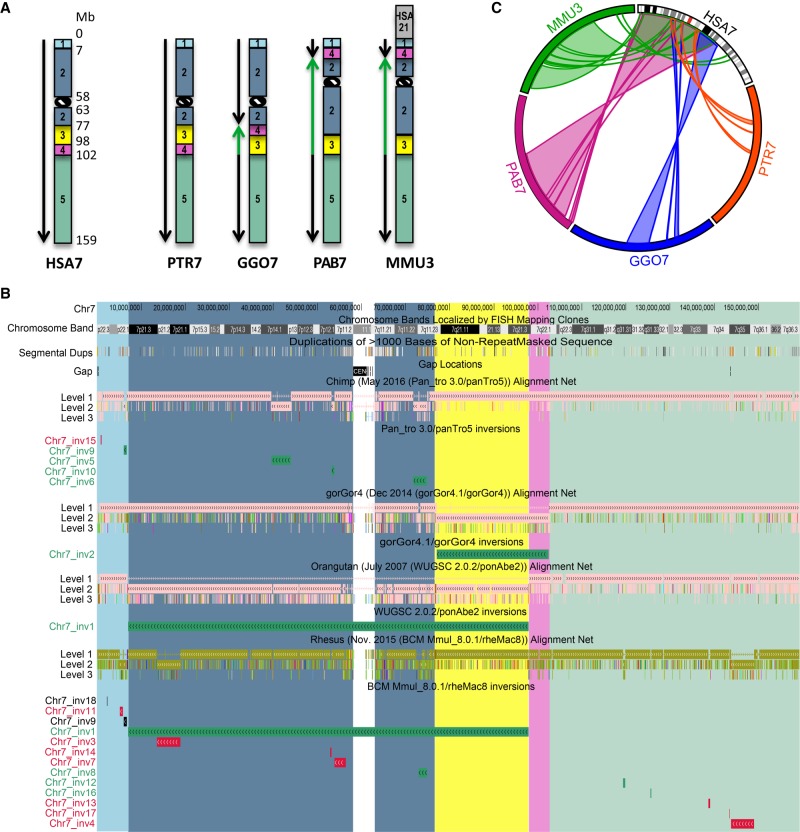
Inversions map of human Chromosome 7. (A) Ideograms for human Chromosome 7 (HSA7) and its chimpanzee (PTR7), gorilla (GGO7), orangutan (PAB7), and macaque (MMU3) homologs. Ideograms only show previously reported inversions larger than 5 Mb. Synteny blocks, distinguished by colors and numbers, represent regions that are inverted in at least one of the species analyzed, but the order of the markers within the block is conserved in all of the different species. Green arrows indicate inverted blocks with respect to human orientation. (B) UCSC Genome Browser view of Chromosome 7 net alignments and inversions predicted in this study between human and nonhuman primate genomes. Regions called to be inverted in this study are shown as green, red, and black horizontal bars and represent real, false, and not determined (ND) inversions, respectively. Synteny block colors are consistent with panel A and allow for comparison of regions called to be inverted in this study with previously identified inversions. For example, Chr7_inv1 corresponds to an inversion involving synteny blocks 2 (blue) and 3 (yellow) that was previously reported in orangutan and macaque (shown in panel A). (C) Circos diagram (Krzywinski et al. 2009) reporting all validated evolutionary inversions between human Chromosome 7 and its primate homologs.

