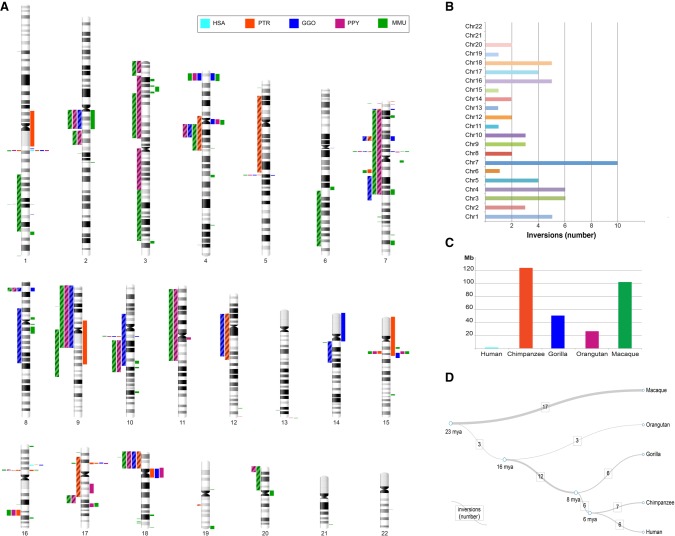
Figure 3.
Map of primate inversions and assemblies errors. (A) All inversions discovered and validated between human, chimpanzee, gorilla, orangutan, and macaque chromosomes are shown on the left side of the chromosome ideograms. In particular, previously reported inversions reidentified in the current study are represented by colored blocks with a diagonal pattern, while novel inversions are depicted with solid color blocks. Errors in human and nonhuman primate assemblies are shown on the right side of the chromosome ideograms. (B) The horizontal bar chart shows the number of inversions per human chromosome. (C) Megabases (Mb) of assembly errors are shown for each species. (D) All inversions for which the lineage specificity has been determined are mapped on a phylogenetic tree (Sudmant et al. 2013) in which the branch thickness is proportional to the number of inversions. (HSA) Homo sapiens, (PTR) Pan troglodytes, (GGO) Gorilla gorilla, (PPY) Pongo pygmaeus, (MMU) Macaca mulatta.

