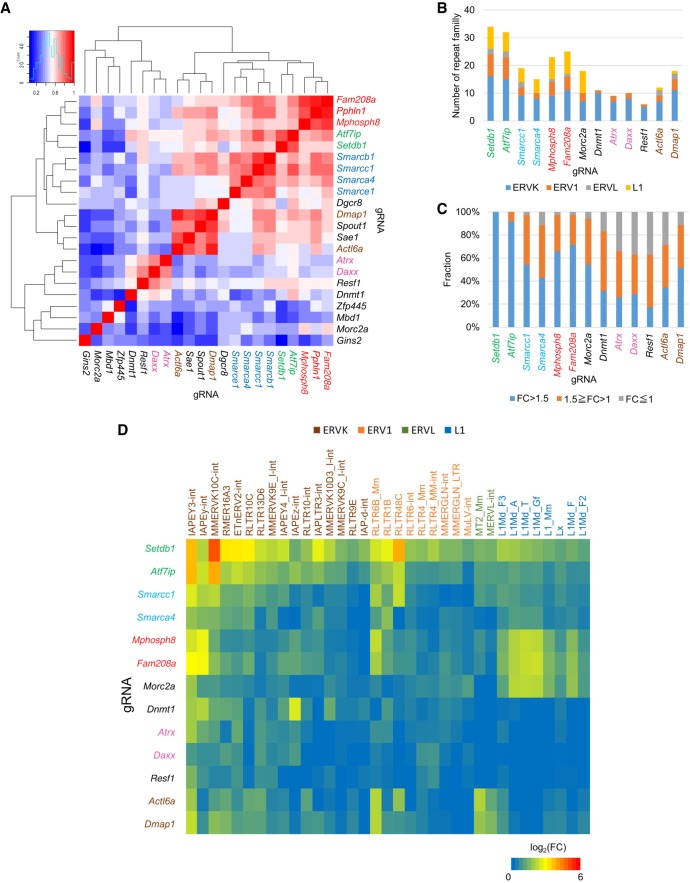
Figure 2.
Repeat regulation of top 20 genes and HUSH components. (A) Cluster analysis of the indicated RNA-seq libraries based on log2 fold change of repeats at 5 d after gRNA plasmid transfection. Heatmap color intensity represents Pearson's correlation coefficient. gRNAs are colored by the type of protein complex: (Red) HUSH complex; (green) SETDB1 complex; (blue) BAF complex; (brown) NuA4 HAT complex; (pink) DAXX/ATRX complex. (B) Number of different repeat families up-regulated in the indicated RNA-seq libraries (FC > 1.5). Only repeat elements for which expression levels were more than 100 in the control sample were used in this analysis. (C) Expression change of repeats repressed by SETDB1 in each gRNA transfected mESCs. Fold expression change is classified by color. (D) Heatmap of log2 fold change of retroelements repressed by SETDB1 in the indicated RNA-seq libraries.

