Figure 3.
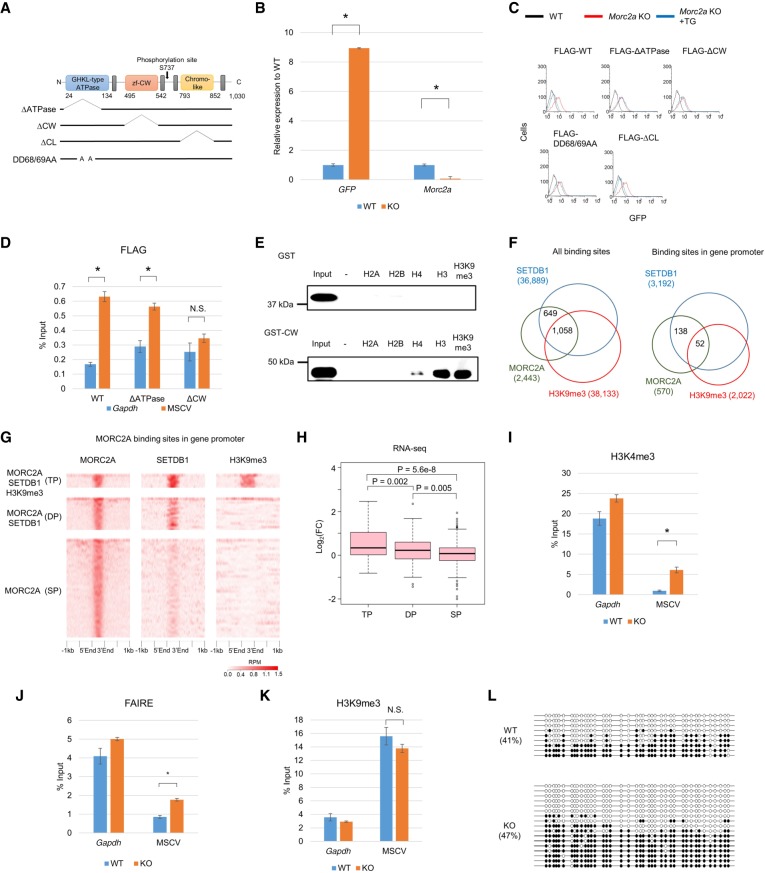
Characterization of MORC2A. (A) Scheme of protein domains of MORC2A and MORC2A mutant molecules used in this study. (B) Relative RNA expression of MSCV-GFP and Morc2a in the Morc2a KO cell line. Relative mRNA expression level was examined by RT-qPCR. (C) Flow cytometric analysis of GFP expression in Morc2a KO cell line complemented with WT or mutant transgene vector. (D) ChIP-qPCR confirmation of MORC2A enrichment on MSCV promoter. Anti-FLAG ChIP-qPCR was performed with Morc2a KO cell line stably expressing FLAG-tagged WT or mutant MORC2A. (E) Peptide binding assay using histone peptide (H2A, H2B, H4, H3, and H3K9me3). GST-tagged MORC2A CW domain and biotinylated histone peptide were mixed, and the peptide-bound GST-fusion was collected by avidin beads. (F) Overlap of MORC2A-, SETDB1-, and H3K9me3-enriched regions in entire genome (left) or gene promoter (right). Publicly available SETDB1 and H3K9me3 ChIP-seq data in mESCs were reanalyzed to obtain SETDB1- and H3K9me3-enriched regions (Karimi et al. 2011). (G) Heat map of MORC2A, SETDB1, and H3K9me3 ChIP-seq enrichment across MORC2A binding sites in gene promoter. ChIP-seq enrichment (reads per million [RPM]) is shown by color scale. MORC2A binding sites were classified by overlap with SETDB1- and H3K9me3-enriched regions: All three factors were colocalized (triple positive [TP]); only SETDB1 was colocalized with MORC2A (double positive [DP]), and MORC2A did not overlap with SETDB1 and H3K9me3 (single positive [SP]). (H) Boxplot showing log2 fold change of gene expression in Morc2a KO cells. Only genes with MORC2A binding sites in their promoter were analyzed, and genes were classified by overlap of MORC2A-, SETDB1-, and H3K9me3-enriched regions. MORC2A binding was correlated with gene silencing, when it was colocalized with SETDB1 and H3K9me3. (I–K) Analysis of chromatin status of MSCV promoter in Morc2a KO cells. H3K4me3 (I) and H3K9me3 (K) were analyzed by ChIP-qPCR, and chromatin compaction was analyzed by FAIRE-qPCR (J). (L) DNA methylation status of MSCV promoter in Morc2a KO cells analyzed by bisulfite sequencing analysis. Open and filled circles represent unmethylated or methylated cytosines, respectively. The percentage of total methylated CpGs/CpGs is presented on the left sides of each data set. Data represent mean ± SE (n = 3). (*) P-value <0.01 (t-test). (N.S.) Not significant. See also Supplemental Figure S3.

