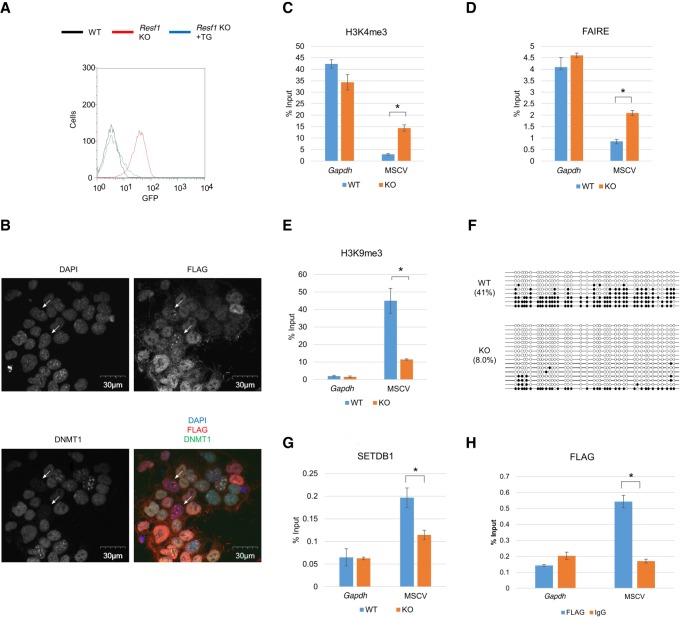
Figure 5.
RESF1 regulates repressive epigenetic chromatin configurations. (A) Flow cytometric analysis of GFP expression in Resf1 KO cell line and the cell line complemented with Resf1 transgene vector. (B) Localization of RESF1 in DAPI-dense region in mESCs characterized by low DNMT1 expression. Cellular localization of RESF1 and DNMT1 analyzed by immunofluorescent in mESCs stably expressing FLAG-RESF1. In a small cell population, DNMT1 expression was low (DNMT1low) (27/1173), and FLAG signals was enriched in DAPI-dense regions (35/1173). Such cells were indicated by the white arrows. DNMT1low mESCs were significantly overlapped with mESCs showing RESF1 enrichment in DAPI-dense regions (21/27, P-value = 8.5 × 10⁻³¹, hypergeometric test). (C–E) Analysis of chromatin status of MSCV promoter in Resf1 KO cells. H3K4me3 (C) and H3K9me3 (E) were analyzed by ChIP-qPCR, and chromatin compaction was analyzed by FAIRE-qPCR (D). (F) DNA methylation status of provirus in Resf1 KO cells analyzed by bisulfite sequencing analysis. In the KO cells, DNA methylation level of MSCV promoter was decreased. (G) Enrichment of SETDB1 in MSCV promoter analyzed by ChIP-qPCR. In Resf1 KO cells, enrichment of SETDB1 on MSCV promoter was reduced. (H) ChIP-qPCR confirmation of RESF1 binding to MSCV promoter. Anti-FLAG ChIPs were performed with Resf1 KO cell line stably expressing FLAG-tagged RESF1. Data represent mean ± SE (n = 3). (*) P-value <0.01 (t-test). See also Supplemental Figure S5.

