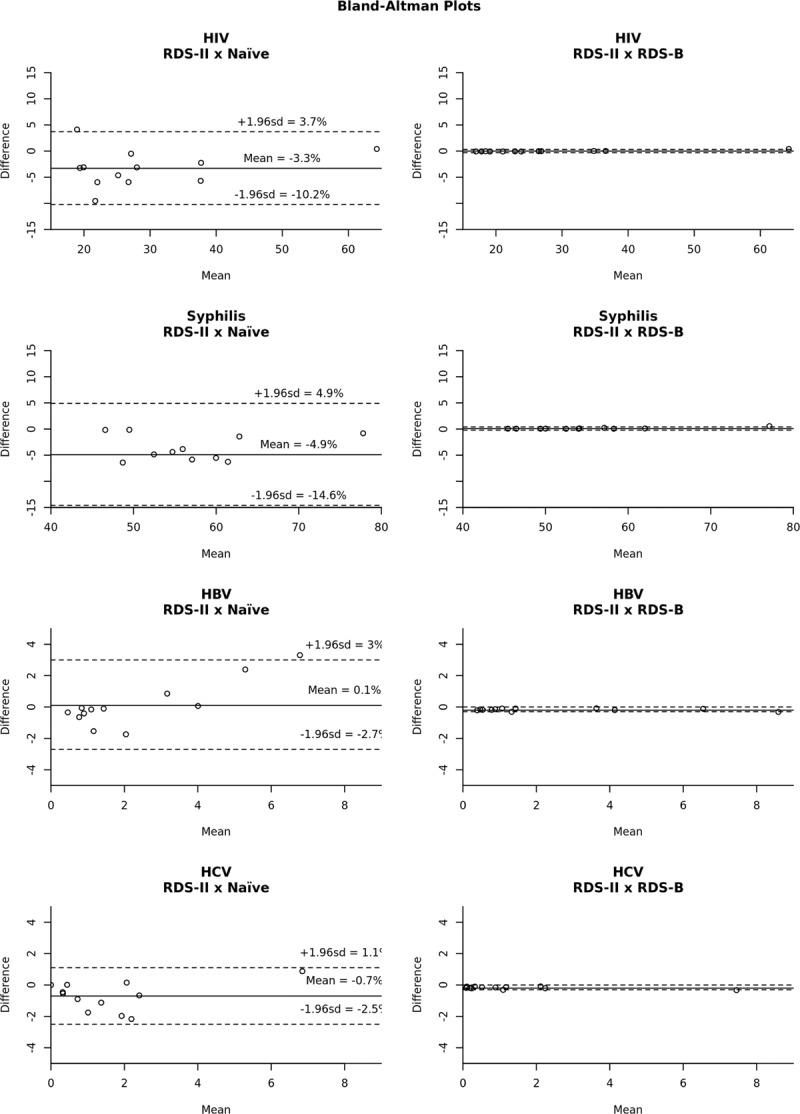
Figure 5.

Bland-Altman plots comparing the assessment of differences between estimators. The differences of estimates for each pair of estimators is ploted against the mean of the same estimates. Solid lines are the mean differences, while traced lines represent the 95% confidence interval for the differences (limits of agreement). It is clear the concordance between RDS-II and RDS-B estimators, regardless of the outcome assessed.
