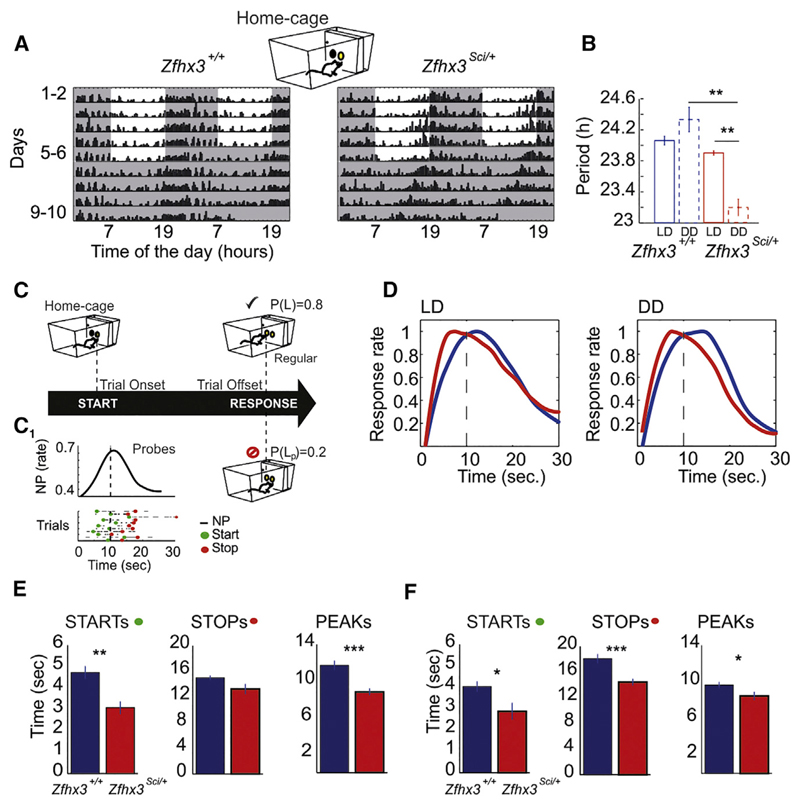
Figure 3. Zfhx3Sci/+ Mutant Mice Shorten Both Circadian Period of Peak Nose-Poking Activity and Short-Interval Responses over 24 hr.
(A) Representative double-plotted actograms of nose-poking activity performed by Zfhx3+/+ and Zfhx3Sci/+ mice in home cages. Mouse nose-poking activity is collapsed into 15-min bins and is represented by black bars. Shaded regions indicate darkness in both the 12:12 light:dark (LD) and dark:dark (DD) conditions.
(B) Periodicities in LD and DD are shown for Zfhx3+/+ and Zfhx3Sci/+ mice.
(C) Representation of the short-interval task in home cages. The cartoon recapitulates how mice can initialize the trial by nose poking in the central hopper of an operant wall; after a FI, a nose poke at the left hopper is rewarded by the release of a food pellet with a probability 0.8. Unrewarded trials (probe trials) have probability of 0.2. (C1) An example of a raster plot and the distribution of nose-poke activity across the fixed-interval target during unrewarded probe trials. Green and red dots in the raster plot represent the “starts” and “stops” of responses extracted from trial-by-trial nose-poking activity (see Experimental Procedures).
(D) Temporal distribution of nose-poking responses in probe trials of Zfhx3Sci/+ and Zfhx3+/+ mice in LD and DD conditions. The FI target was 10 s.
(E and F) Mean values and SEMs of starts, stops, and peaks (start + stop/2) in LD (E) and DD (F) conditions. Significant differences between the groups are derived via one-way ANOVA. Significant differences are indicated as follows: ***p < 0.0005; **p < 0.005; *p < 0.05.

