
Figure 5. Association of total disease burden with age, m.3243A>G heteroplasmy level and mtDNA copy number in skeletal muscle.
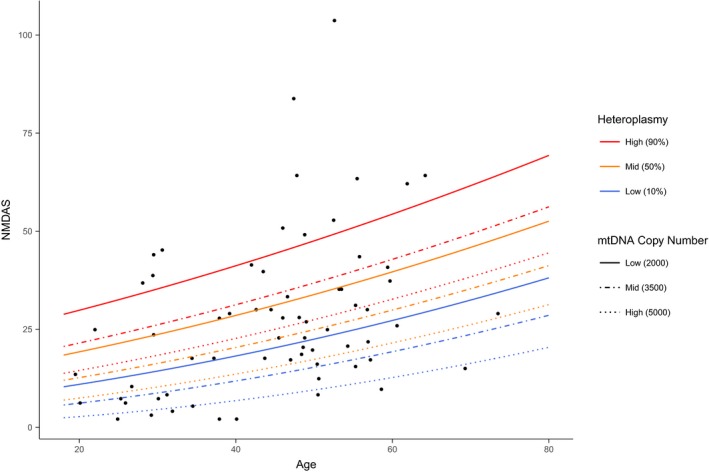
Lines represent scores predicted using a linear model (with the square root of NMDAS score as the dependent variable and age, skeletal muscle heteroplasmy and mtDNA copy number as independent variables). Individuals with 10% (blue), 50% (orange) and 90% (red) heteroplasmy levels and low standardised mtDNA copy number (2,000 copies/nucleus; solid line), medium copy number (3,500 copies/nucleus; dashed line) and high copy number (5,000 copies/nucleus; dotted line) are represented.