Figure 3.

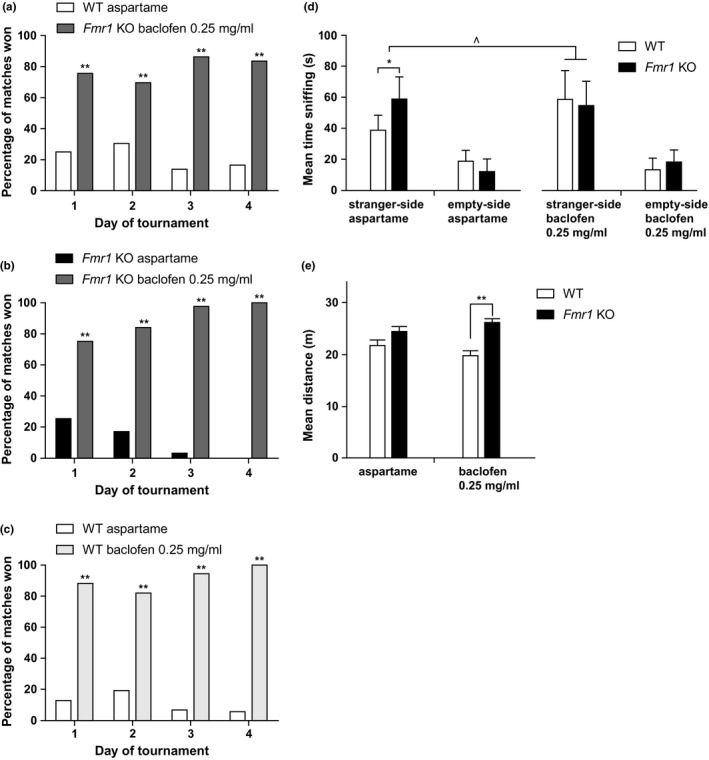
The effect of 0.25 mg/ml baclofen treatment on the behavior of Fmr1 KO mice and WT littermates in the automated tube test and the three‐chamber sociability test. (a–c) Results of the automated tube test expressed in percentage of matches won. (a) Fmr1 KO mice treated with 0.25 mg/ml baclofen win most matches against WT littermates receiving aspartame drinking water (binomial test, 70%–90%, p = .000, n = 6 per group). (b) Fmr1 KO mice treated with 0.25 mg/ml baclofen water win most matches from Fmr1 KO mice receiving aspartame water, winning 75% of the matches on day 1, which increases to 100% on day 4 (p = .002 on day 1 to p = .000 on day 4, n = 6 per group). (c) WT littermates treated with 0.25 mg/ml baclofen win most matches from WT littermates receiving aspartame water, winning 80%–100% of matches (p = .01 on day 1 to p = .000 on day 4, n = 4 per group). (d) Three‐chamber sociability test. Sociability behavior, expressed as average time spent sniffing the stranger mouse, compared to the time spent sniffing the empty cage. WT aspartame n = 10, Fmr1 KO aspartame n = 10, WT baclofen n = 10, Fmr1 KO baclofen n = 10. All groups sniff the stranger mouse more than the empty cage (two‐way RM ANOVA with within‐subject factor side of stranger, p = .000). Fmr1 KO mice receiving aspartame water sniff the stranger mouse significantly more than WT littermates receiving aspartame water (two‐way RM ANOVA, p = .004). WT littermates receiving baclofen water sniff the stranger mouse more than WT littermates receiving aspartame water (two‐way RM ANOVA, p = .011), making baclofen‐treated WT mice comparable to Fmr1 KO mice receiving aspartame or Fmr1 KO mice receiving baclofen. Data are expressed as mean ± SE. (e) Locomotor activity during sociability phase of the three‐chamber sociability test. The locomotor activity does not differ between treatments. Fmr1 KO mice receiving baclofen have increased locomotor activity compared to WT littermates receiving baclofen (two‐sided independent‐samples t‐test, p = .000). Data presented as mean ± SE. p‐Values: ^<.05, *<.01, **<.001
