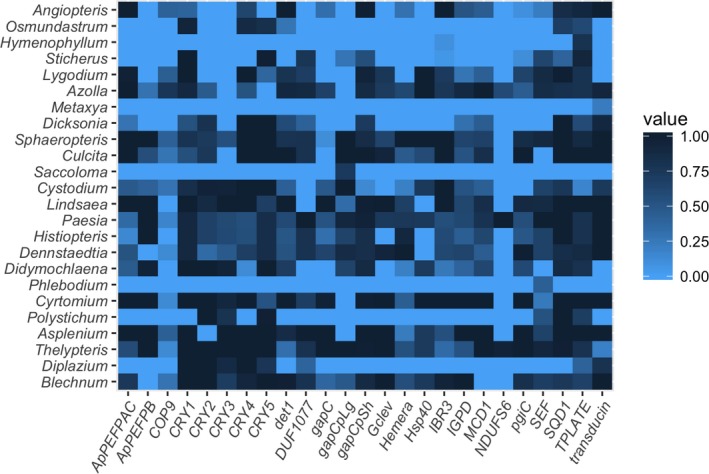
Figure 1.

Heat map showing recovery efficiency for 25 genes targeted in 24 fern taxa. Each column corresponds to a gene and each row is a sample. The shading of each box represents the proportion of the target gene length recovered; darker colors indicate a higher percentage of the gene was recovered.
