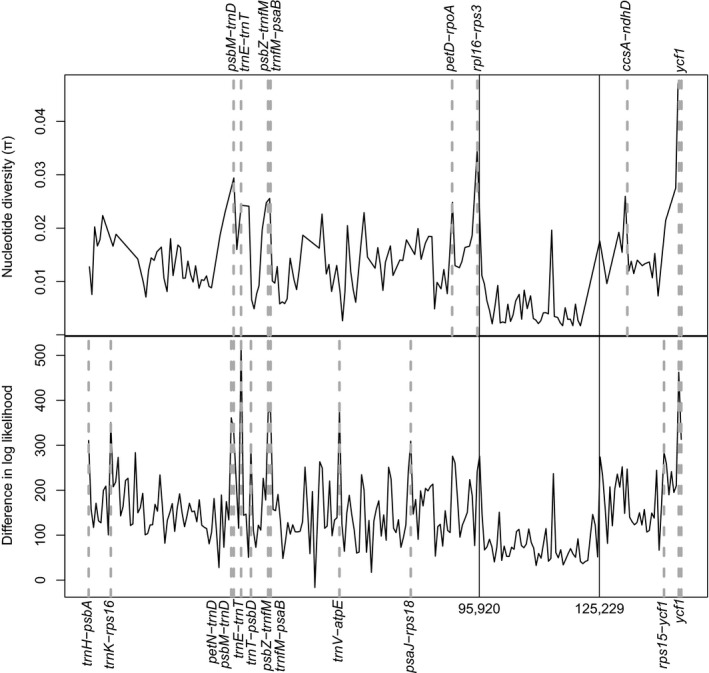
Figure 2.

Sliding 600‐site window analyses on the Lecythidaceae plastome alignment of 24 species showing nucleotide diversity (π) (top) and alignment site‐wise differences in log‐likelihood (LD) calculated from the chloroplast topology versus the average scores of 1000 random trees (bottom). Regions with π and LD above the 95th percentiles are indicated with dashed lines. Continuous vertical lines indicate the boundaries, from left to right, among the large single copy, the inverted repeat, and the small single copy.
