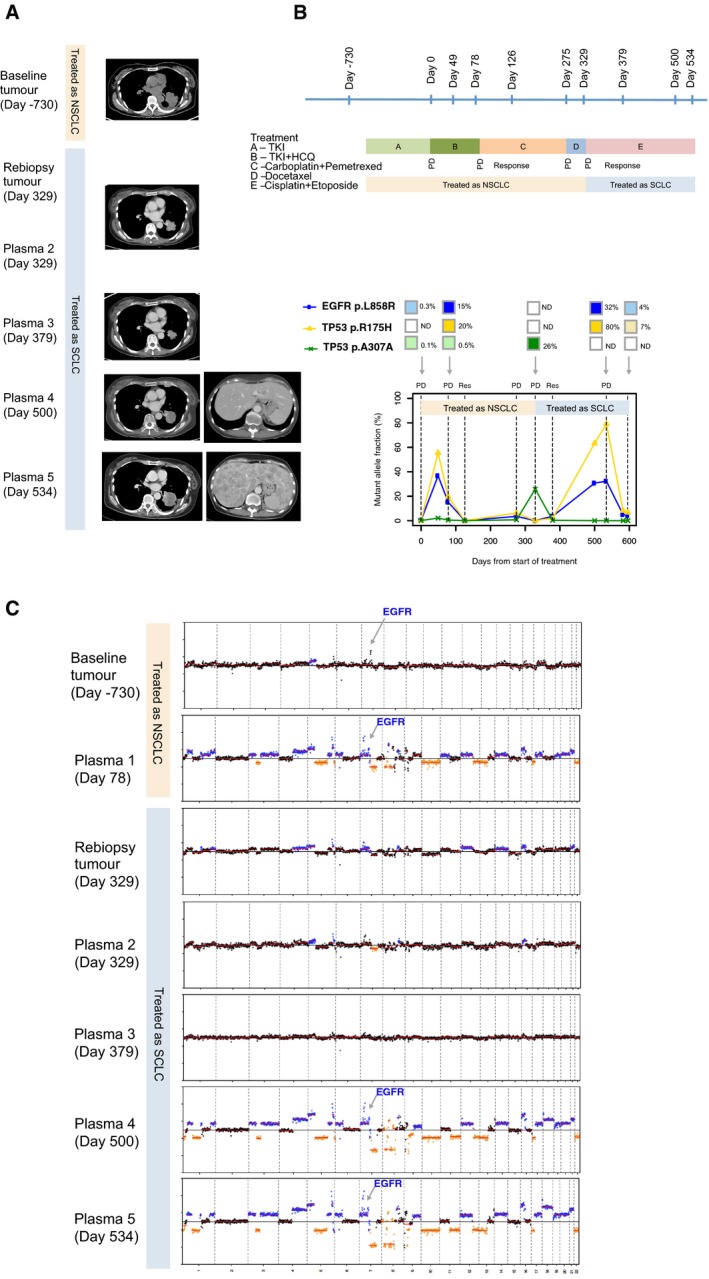
Figure 6. Plasma analysis reveals global copy number changes and ctDNA dynamics in patients who have undergone histological transformation to SCLC (patient 218).

- CT images of the left lung tumour at baseline (day −730), and upon progression on EGFR‐TKI (day 78). The patient was treated for non‐small‐cell lung cancer from days 78 to 329 with two lines of chemotherapy: initially carboplatin and pemetrexed, followed by docetaxel. The CT image corresponding to plasma 2 and re‐biopsy of the tumour at day 329 was upon progression on the above two lines of chemotherapy. CT image corresponding to plasma 3 at day 379 was upon response to small‐cell lung cancer chemotherapy. CT corresponding to days 500 and 524 are upon progression on cisplatin and etoposide. Marked growth of the lung and liver lesions are demonstrated, and this corresponds to marked CNA changes on plasma drawn on those respective days.
- The timeline of the patient's treatment is shown, alongside timepoints where tumour and plasma samples were available for analyses. The bottom chart shows the respective mutations that were found, and the changes to the mutation allele fractions in a longitudinal timeline.
- Global copy number profiles in tumour and plasma samples are shown: Tumour samples at baseline diagnosis of non‐small‐cell lung cancer (day −730) and at transformation to small‐cell lung cancer (day 329). For plasma samples, the following were available: days 78 (upon progression on EGFR‐TKI); 329 (at transformation to small‐cell lung cancer); 379 (at response to small‐cell lung cancer); 500 and 534 (progression on small‐cell lung cancer treatment).
