-
A
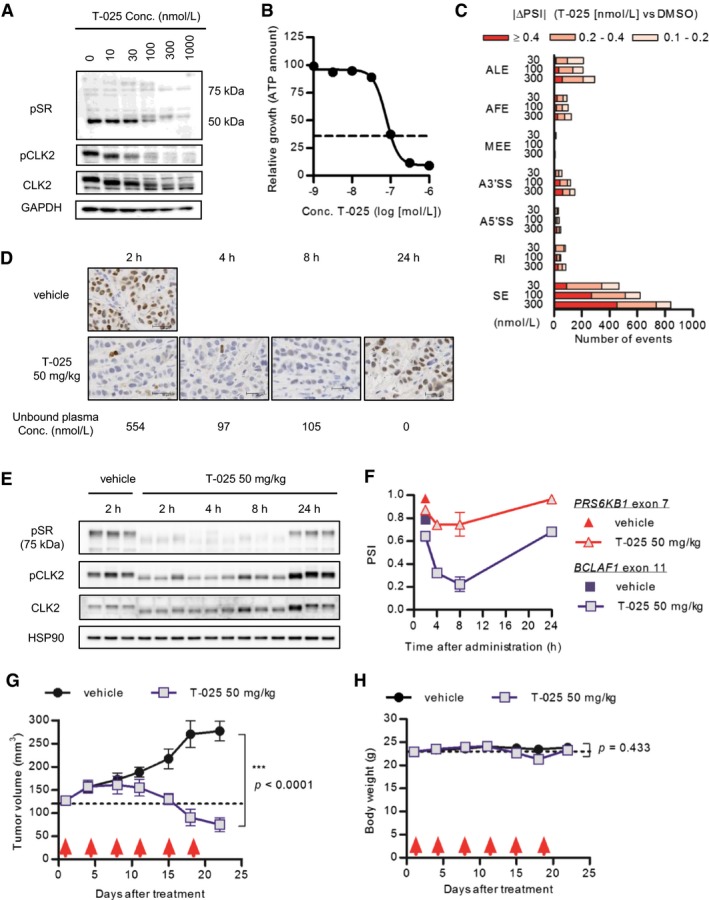
MDA‐MB‐468 cells were treated with T‐025 for 6 h, and phosphorylation levels were detected via immunoblotting with phospho‐specific antibody.
-
B
T‐025 dose–response curve in MDA‐MB‐468 cells for 72‐h treatment. The black dotted line indicates the relative ATP value prior to treatment (Day 0).
-
C
The number of AS events modulated by T‐025 treatment for 6 h in MDA‐MB‐468 cells. The numbers of AS events with a BF > 20 and |ΔPSI| > 0.1 were counted and categorized according to the AS type (SE, skipped exon; RI, retained intron; A5′SS, alternative 5′‐splice‐site; A3′SS, alternative 3′‐splice‐site; MEE, mutually exclusive exon; AFE, alternative first exon; ALE, alternative last exon).
-
D–F
MDA‐MB‐468 xenograft tumors treated with 50 mg/kg of T‐025 were sampled and analyzed by immunohistochemistry (F), immunoblotting (E), or RT–PCR (F). Representative images of pCLK2 stained tumors and scale bar (30 μm) are shown. Also shown: The mean unbound plasma T‐025 concentration was calculated using protein binding after oral administration.
-
G, H
Anti‐tumor efficacy of T‐025 in MDA‐MB‐468 xenograft models. T‐025 was administered twice daily on 2 days per week (red arrows). Tumor volume (G) and body weight (H) during the efficacy study are shown as means ± s.e.m. (n = 5).
Data information: In (B, D, and F), data are shown as the means ± s.d. of three independent experiments (
n =
3). In (G and H), an unpaired Student's
t‐test was performed.
Source data are available online for this figure.

