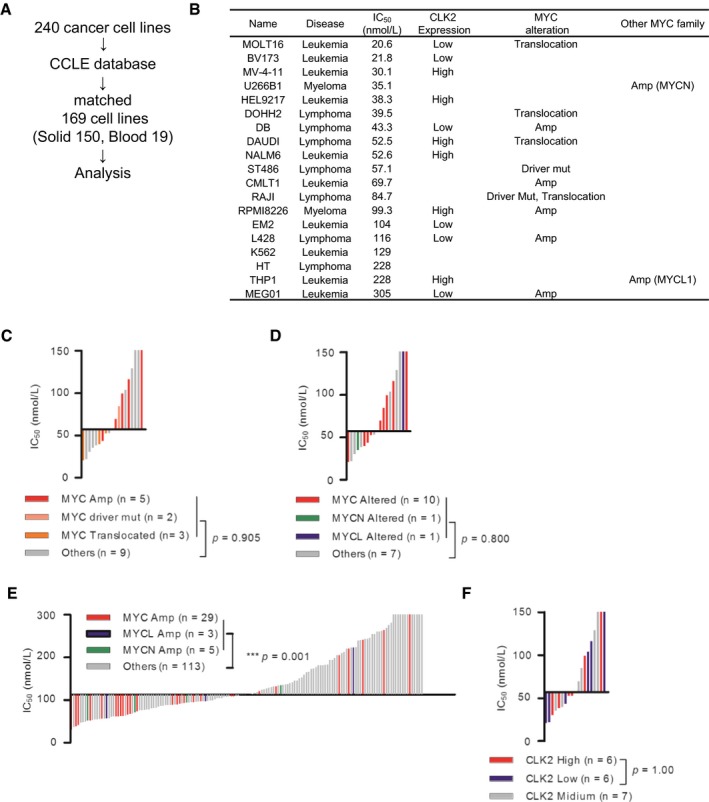
Analysis flow of the tested cell lines.
IC50 value, CLK2 expression, and MYC status of 19 hematological cancer cell lines are shown.
Correlation between T‐025 sensitivity and MYC status in the hematological cancer cell lines (n = 19). Each bar indicates a single cell line, and colored bar indicates cell lines with altered MYC.
Correlation between T‐025 sensitivity and MYC family gene status in the hematological cancer cell lines (n = 19). Each bar indicates a single cell line, and colored bar indicates cell lines with altered MYC family gene.
Correlation between T‐025 sensitivity and MYC family gene status in the solid cancer cell lines (n = 150). Each bar indicates a single cell line, and colored bar indicates cell lines with altered MYC family gene.
Correlation between T‐025 sensitivity and CLK2 expression in the hematological cancer cell lines (n = 19). Each bar indicates a single cell line, and blue, gray, or red bar indicates cell lines with high, medium, or low CLK2.
Data information: In (C–F), a Mann–Whitney test was performed.

