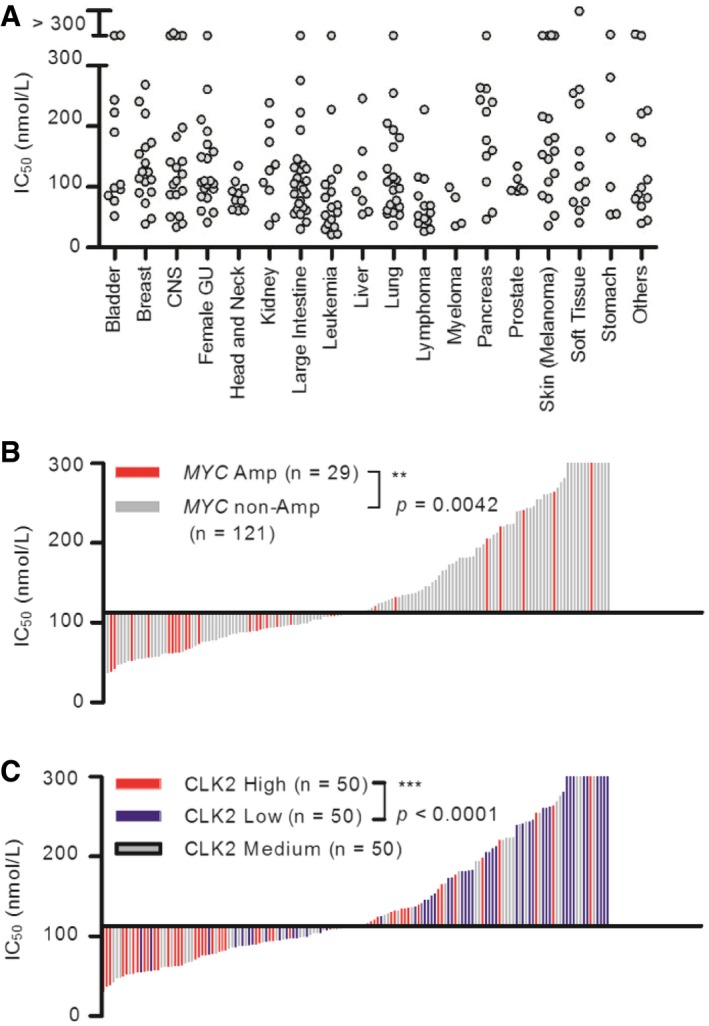
Figure 3. T‐025 exhibited a board range of anti‐proliferative effect in a panel of cancer cell lines.

- IC50 values of T‐025 in 240 cell lines. Each gray circle indicates a single cell line sorted according to its original organ/disease type.
- Correlation between T‐025 sensitivity and MYC amplification status in solid cancer cell lines (n = 150). Each bar indicates a single cell line, and red bar indicate cell lines with amplified MYC.
- Correlation between T‐025 sensitivity and CLK2 expression status in solid cancer cell lines (n = 150). Each bar indicates a single cell line, and red, gray, or blue bar indicate cell lines with high, medium, or low CLK2.
