-
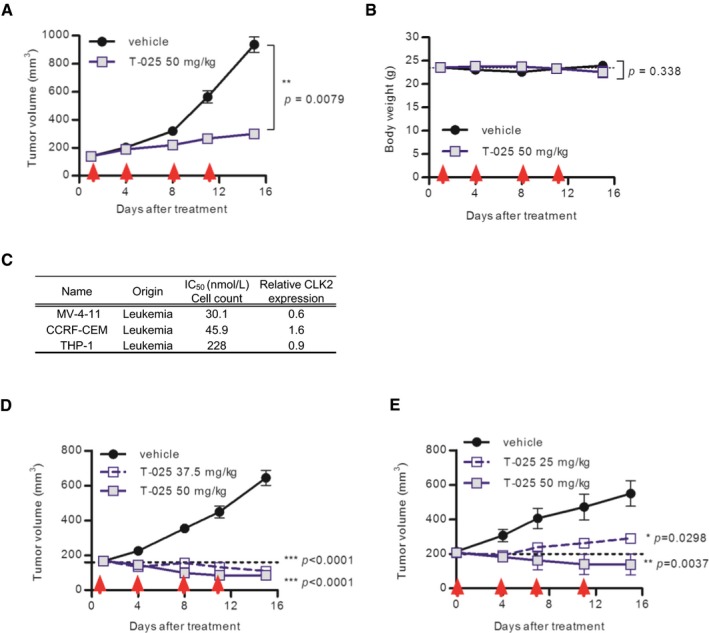
A, B
Anti‐tumor efficacy of T‐025 in lung cancer NCI‐H1048 xenograft model. Red arrows indicate the day of treatment in twice weekly regimens. Tumor volume (A) and body weight (B) during the treatment cycle are shown.
-
C
Correlation between growth suppressive sensitivity to T‐025 and the protein level of CLK2 in the hematological cancer cell lines.
-
D
Anti‐tumor efficacy of T‐025 in acute myeloid leukemia MV‐4‐11 xenograft model.
-
E
Anti‐tumor efficacy of T‐025 in patient‐derived xenograft model of acute myeloid leukemia. T‐025 was given twice daily at twice weekly.
Data information: In (A, B, and D), data are shown as the mean ± s.e.m. (
n =
5). In (E), data are shown as the mean ± s.e.m. (
n =
3). In (A), a Mann–Whitney test was performed. In (B), an unpaired Student's
t‐test was performed. In (D and E), Tukey's test was performed.

