-
A, B
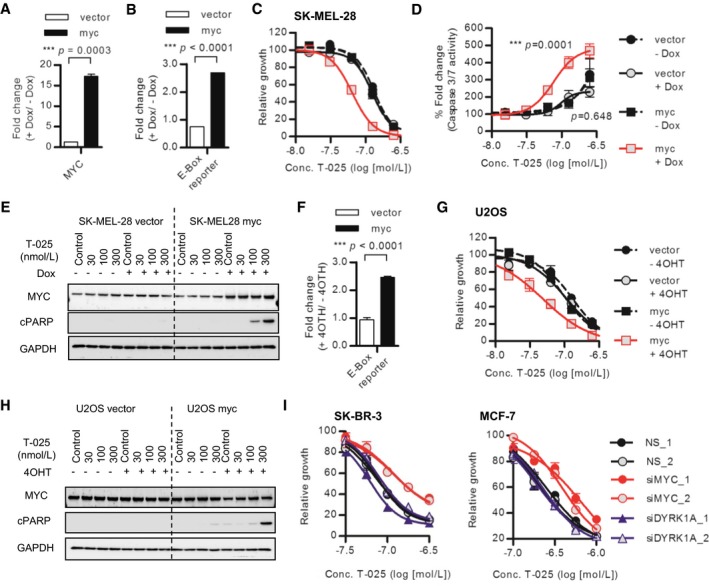
Dox treatment‐induced/activated MYC in MYC‐inducible SK‐MEL‐28 cells. SK‐MEL‐28 cells were treated with 0.5 μg/ml Dox for 54 h, and MYC mRNA level was analyzed with RT–PCR (A). E‐Box reporter activities of SK‐MEL‐28 cells after 48 h of Dox treatment were measured as MYC transcriptional activities.
-
C
Dose–response growth inhibition curve of T‐025 in MYC‐inducible SK‐MEL‐28 cells. SK‐MEL‐28 cells pretreated with Dox for 48 h were additionally incubated with T‐025 for 72 h.
-
D, E
Apoptosis induction caused by T‐025 in MYC‐inducible SK‐MEL‐28 cells. SK‐MEL‐28 cells pretreated with Dox for 48 h were additionally treated with T‐025 for 24 h, and then, apoptosis was measured by caspase‐3/7 activity (D) or immunoblotting of cPARP1 (E).
-
F
4OTH treatment‐induced/activated MYC in MYC‐inducible U2OS cells. E‐Box reporter activities of U2OS cells after 48 h of 4OTH (500 nmol/l) treatment were measured as MYC transcriptional activities.
-
G
Dose–response growth inhibition curve of T‐025 in MYC‐inducible U2OS cells. U2OS cells pretreated with 4OTH for 48 h were additionally incubated with T‐025 for 72 h.
-
H
Apoptosis induction caused by T‐025 in MYC‐inducible U2OS cells. U2OS cells pretreated with 4OTH for 48 h were additionally treated with T‐025 for 24 h, and then, apoptosis was measured by immunoblotting of cPARP1.
-
I
Dose–response growth inhibition curve of T‐025 in SK‐BR3 or MCF7 cells transfected with MYC or DYRK1A siRNA. The cells pretreated with siRNA for 24 h were additionally incubated with T‐025 for 72 h.
Data information: In (A, B and F), an unpaired Student's
t‐test or an unpaired Student's
t‐test with Welch's correction was performed. In (D), Tukey's test was performed. In (A–D, F, G and I), data are shown as the means ± s.d. of three independent experiments (
n =
3). IC
50 values and 95% confidence intervals (95% CIs) in (C, G, and I) are described in
Appendix Fig S8.
Source data are available online for this figure.

