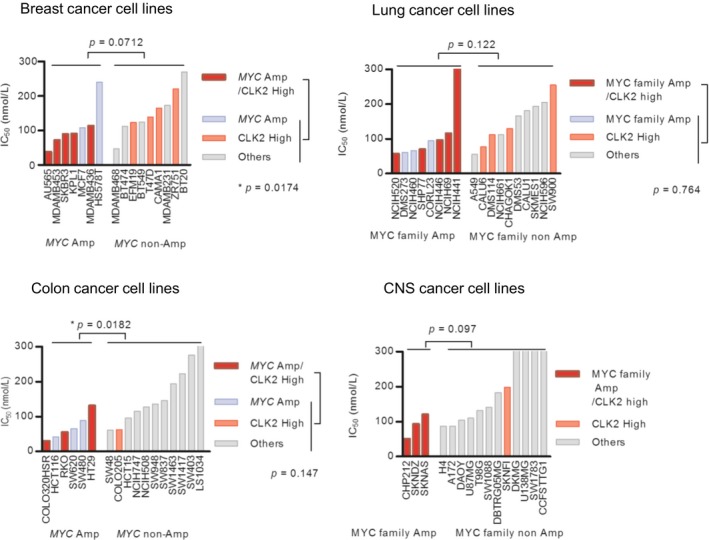
Figure EV5. Additional analysis of Oncopanel based on the original organ type.

IC50 values of the cancer cell lines with both high CLK2 and amplified MYC were compared with that without these biomarkers. A Mann–Whitney test was performed.

IC50 values of the cancer cell lines with both high CLK2 and amplified MYC were compared with that without these biomarkers. A Mann–Whitney test was performed.