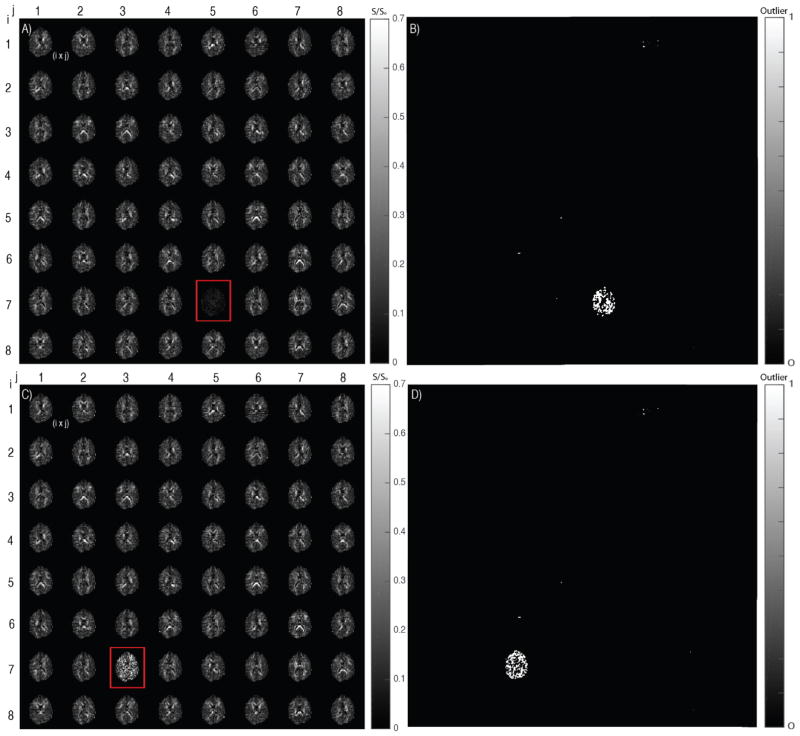
Figure 3.
Middle axial slice shown for the diffusion data and the binary outlier map. i*j denotes the weighted gradient volume corresponding to gradient directions. A) Ground truth data when corrupted with an artifact containing gradient volume from the motion scan. B) Outlier detected on the corrupted gradient volume in (A). C) Simulated good scan data when corrupted artificially by random multiplication and division of signal intensity using a corruption factor (Slash Model). D) Outliers detected with the artificial corrupted gradient volume in (C).

