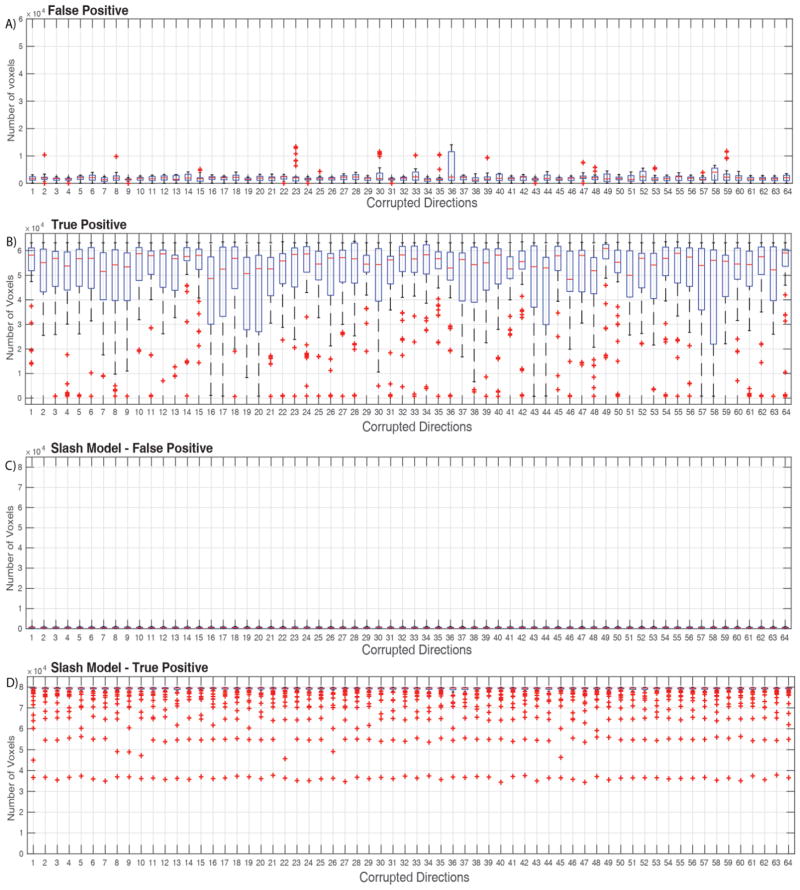
Figure 4.
Count of outliers detected in corrupted gradient volumes (True Positive) and uncorrupted gradient volumes (False Positive). Each bin consists of 64 repeated measurements. Total number of voxels per volume are 92,248. A) False positive, outliers detected in the uncorrupted gradient volume when using corrupted gradient volumes from motion scan. B) True Positive, outliers detected in the uncorrupted gradient volumes which has random volumes swapped in from the motion scan. C) False positive, outliers detected in the uncorrupted gradient volume when using Slash model corruption factor for random gradient volumes. D) True Positive, outliers detected in gradient volumes when using Slash model corruption factor for random gradient volumes.

