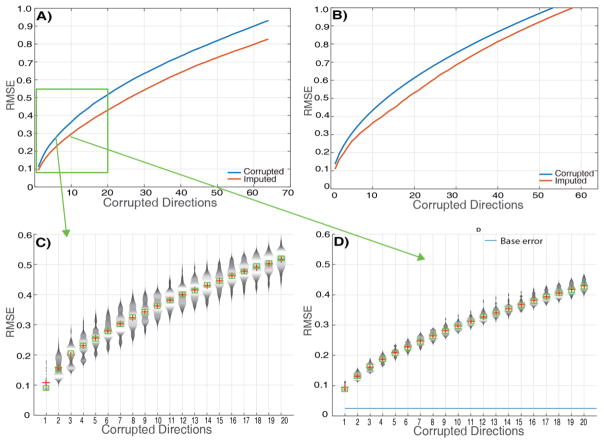
Figure 5.
A) RMSE of corrupted and imputed signal intensities across the brain when compared with the ground truth. Corrupted gradient volumes were swapped from the motion scan. Each point represents RMSE across 64 measurements. B) RMSE of corrupted and imputed signal intensities when compared with ground truth. Gradient volumes were corrupted with a corruption factor artificially (slash model). Each point represents RMSE across 64 measurements. C) Violin plot of 64 repeated measures of RMSE per bin with random permutations before imputation for the first 20 corrupted gradient volumes. The corrupted volumes were swapped in from motion scan data. D) Violin plot of 64 repeated measures of RMSE per bin with random permutations after imputation for the first 20 corrupted gradient volumes. The corrupted volumes were swapped in from motion scan data.

