
Figure 1.
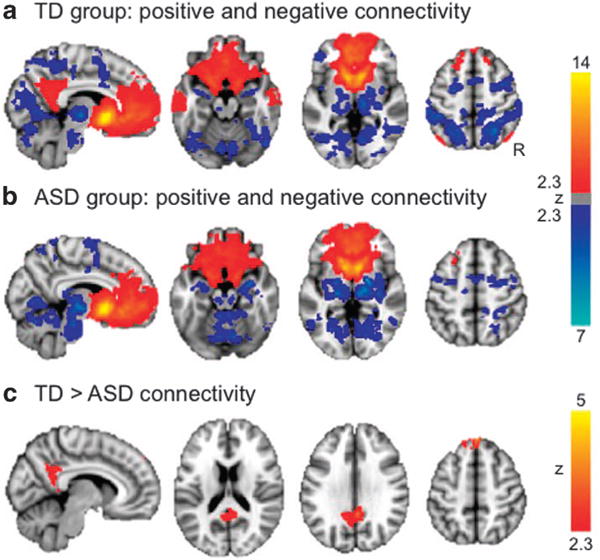
NAcc whole-brain connectivity. Warm colors indicate positive connectivity with the seed region; cool colors represent negative connectivity. (a) Connectivity in the TD group. (b) Connectivity in the ASD group. Results for (a and b) presented at z>2.3, P<0.01, cluster corrected for multiple comparisons at P<0.05. (c) Areas for which NAcc showed differential connectivity between diagnostic groups, z>2.3, P<0.01, cluster corrected for multiple comparisons at P<0.05. See also Supplementary Table 1. ASD, autism spectrum disorder; NAcc, nucleus accumbens; TD, typically developing.