
Figure 2. There is no change in the monocyte chemoattractant protein 1 (MCP-1) in the first 3 days but expression drops with SAHA treatment at day 5 post-MI.
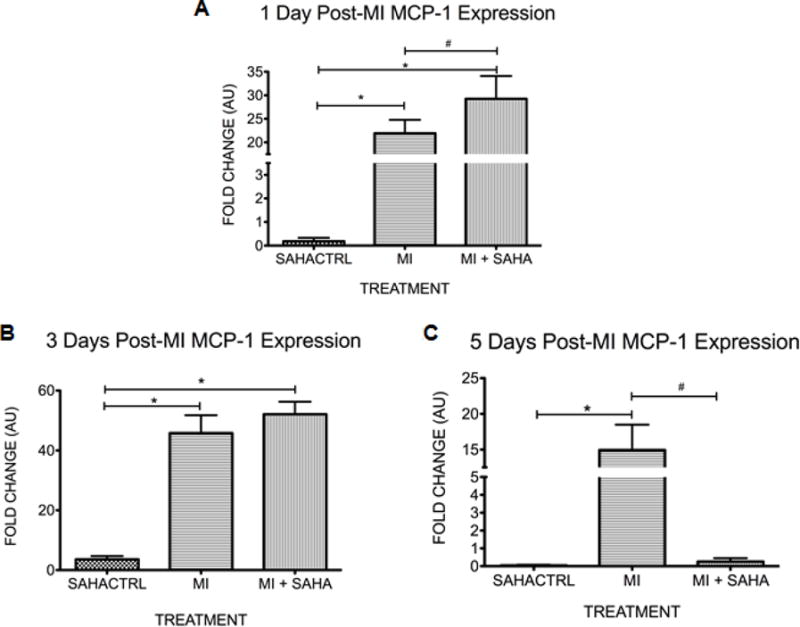
qRT-PCR analysis of monocyte chemoattractant protein 1 (MCP-1) within the infarct zone at A)1 day, B) 3 days and C) 5 days post-MI. The fold change in mRNA value are shown as fold change over sham SAHA treated animals. Values of all qRT-PCR data are normalized to GAPDH. Each bar represents the fold change +/− SEM of three independent experiments with a group of at least n=3 animals per treatment. #p<0.05 vs control, *p<0.05 vs MI, by one-way ANOVA and Bonferroni post-test.