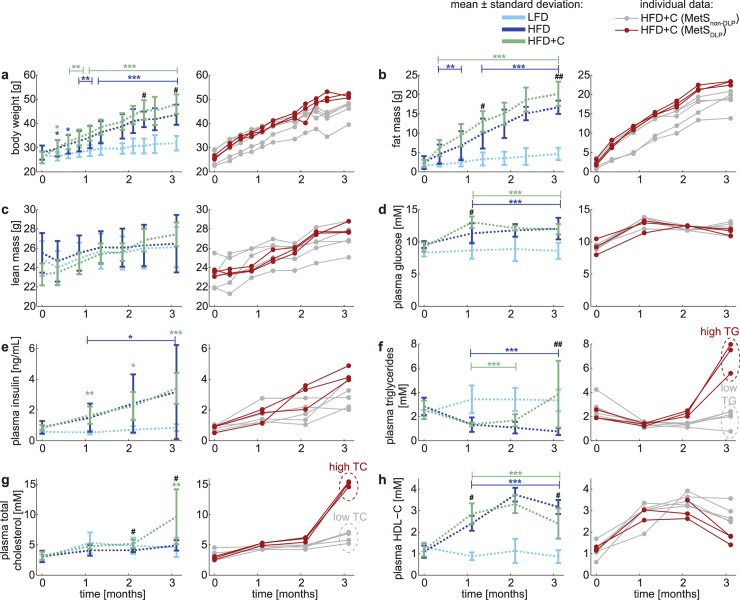
Fig 1. In vivo development of the Metabolic Syndrome results in different phenotypes.
Experimentally observed metabolic parameters upon dietary induction in male E3L.CETP mice over the time course of three months is displayed in two ways: in the left panels the data are expressed as mean ± standard deviation (error bars) for the low-fat diet (LFD; n = 8; light blue), high-fat diet (HFD; n = 12 (pooled from two groups n = 7 for the full time period, n = 5 until 2 months of dietary induction; dark blue) and high-fat diet with 0.25% cholesterol (HFD+C; n = 8; green) groups, whereas in the right panels the data of the animals on HFD+C are depicted for each animal individually. Individuals in this cohort were subdivided into two groups based on the plasma triglyceride (TG) and plasma total cholesterol (TC) levels. The dyslipidemic Metabolic Syndrome phenotypes are depicted in red (MetSDLP; mice with high plasma TG and simultaneous high plasma TC at t = 3 months) and the non-dyslipidemic Metabolic Syndrome phenotypes in gray (MetSnon-DLP; mice with low plasma TG and simultaneous low plasma TC at t = 3 months). Differences between groups were determined using one-way ANOVA test. When significant differences were found, Fisher’s LSD test was used as a post hoc test to determine the differences between two independent groups: * P<0.05; ** P<0.01; *** P<0.001 HFD as compared to LFD # P<0.05; ## P<0.01; ### P<0.001 HFD+C as compared to HFD.

