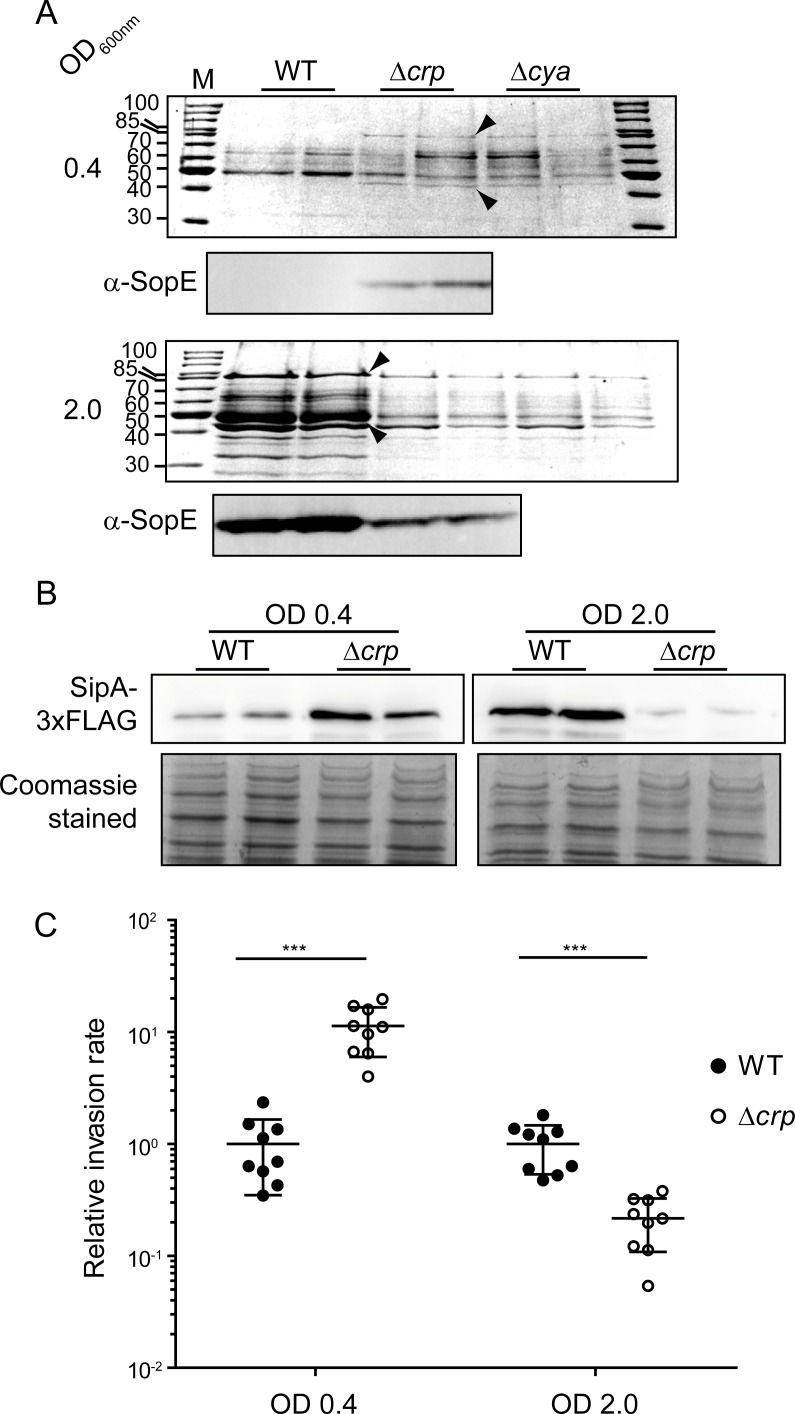
Fig 2. Effect of crp and cya deletion on the expression of SPI-1 effector proteins.
(A) Proteins from cell-free supernatants from cultures of the wild-type (WT), Δcrp and Δcya derivative strains grown up to mid-logarithmic (OD600nm 0.4) or early stationary (OD600nm 2.0) phase were TCA precipitated. The resulting extracts were analyzed by SDS-PAGE and Coomassie Blue staining. Size in kDa of the molecular mass marker (M) is indicated. Arrowheads indicate the protein bands corresponding to SipA (upper band) and SipC (lower band). Immunodetection of SopE protein (α-SopE) was performed in WT and Δcrp extracts. (B) Immunodetection of SipA-3xFLAG was performed on whole cell extracts from cultures of the WT and Δcrp derivative strains grown as in A. Coomassie Blue stainings of the whole cell extracts serve as loading controls. In A and B, extracts from two independent cultures of the same strain were analyzed. Full length images of the Western blots, including molecular mass markers, are shown in S12 Fig. (C) Invasion of HeLa cells. Cultures of the WT and Δcrp strains were grown as in A and assessed for invasion of HeLa cells. Invasion rates were calculated and given as relative rate, the reference value of WT was set to one in both mid-logarithmic and early stationary phase cultures. The invasion rates were 0.7 x 10⁻³ and 2.4 x 10⁻² for the WT in mid-logarithmic and early stationary phase, respectively. ***, p< 0.001.

