
Fig 4. Concentrations of cytokines by quartiles of the estimated global genetic ancestry in African American women.
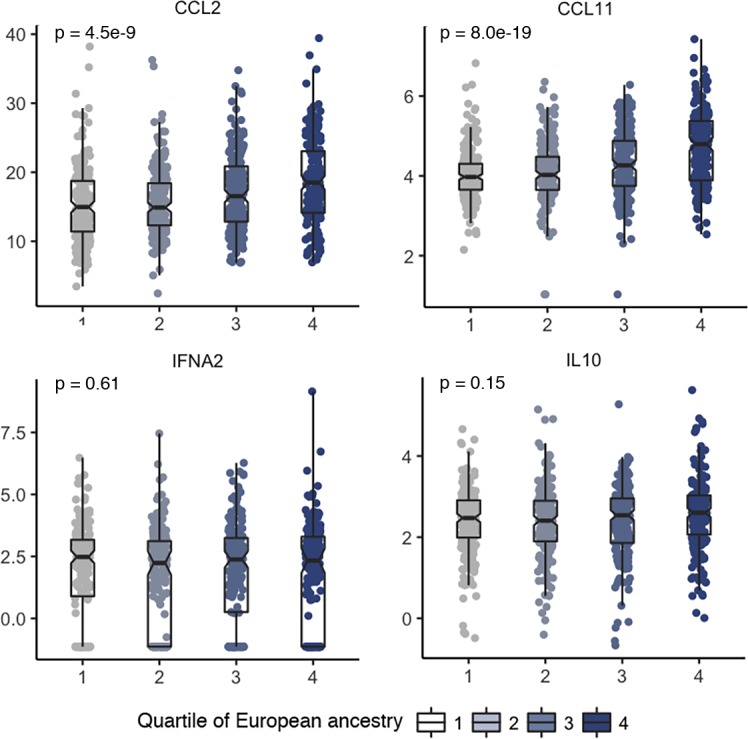
Plasma concentrations of the four cytokines that remained significantly different between African American (AA) and European American (EA) women after controlling for covariates are plotted by the quartiles of the estimated global genetic ancestry among AA women. The quartiles for the estimated European genetic ancestry are: ≤0.08 (n = 200), 0.09–0.12 (n = 198), 0.13–0.20 (n = 201), and ≥0.21 (n = 201). Each dot is a sample and the samples are grouped by quartiles of genetic ancestry. The bar in the middle of a notched box indicates the subgroup median, and the lower and upper edges indicate the first and third quartiles, respectively. The concentrations were natural log-transformed for all markers except CCL2 which was squared root-transformed. The p-values were from an ANOVA test, which remained essentially unchanged after controlling for covariates including study, season and year of blood collection, age and body mass index (BMI) in linear regression models.