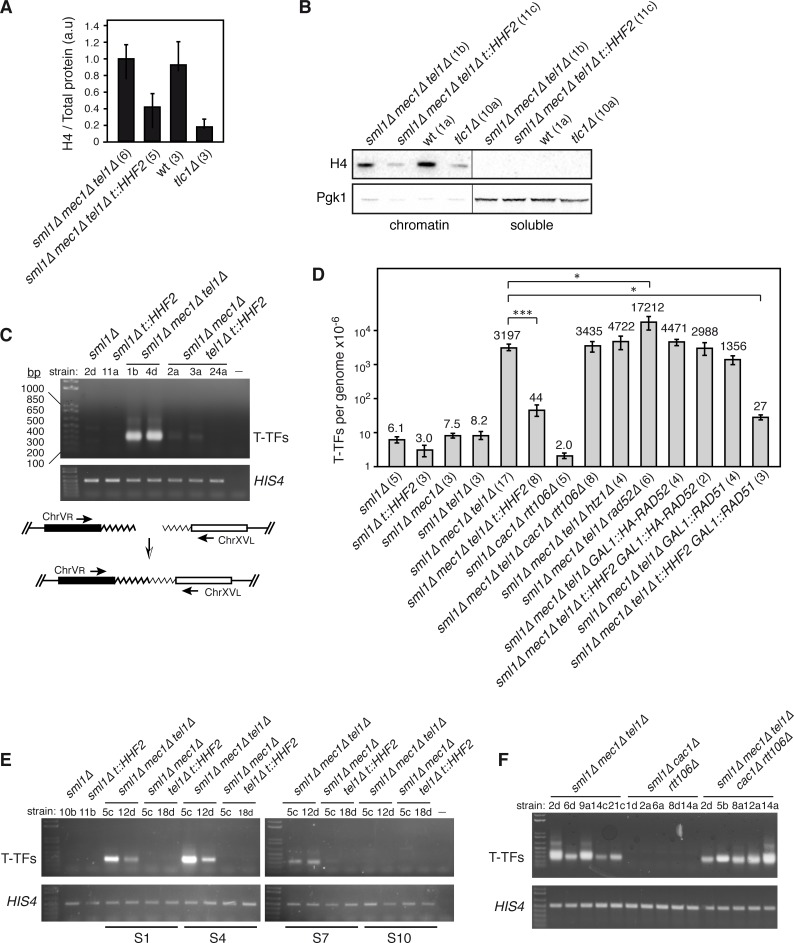
Fig 1. Histone depletion prevents T-TFs in mec1Δ tel1Δ pre-senescent cells.
(A) Histone H4 levels in mec1Δ tel1Δ and mec1Δ tel1Δ t::HHF2 cells (sml1Δ background), and wild type and tlc1Δ cells from streak 1-derived cultures as determined by western blot. The amount of histone H4 was normalized to the total amount of protein. The average and SEM of the indicated number of independent strains are shown. (B) Histone H4 and Pgk1 levels at chromatin and soluble fractions of the indicated strains from S1-derived cultures. (C) T-TFs in wild type, t::HHF2, mec1Δ tel1Δ and mec1Δ tel1Δ t::HHF2 (sml1Δ background) from liquid cultures from streak 1 as determined by semiquantitative PCR. A PCR control without DNA was included (-). A DNA fragment from HIS4 was PCR-amplified as input control. A scheme of the PCR assay to follow the accumulation of T-TFs is shown. (D) T-TF frequency of the indicated strains as determined by quantitative PCR from S1 streaks. The average and SEM are shown, except for mec1Δ tel1Δ t::HHF2 GAL1::HA-RAD52 in which the range is indicated, as n = 2. The number of DNA samples from independent strains, which include those used for semiquantitative PCR and telomere length analyses, is shown in parenthesis for each genotype. One (P-values <0.01) and three (P-values <0.0001) asterisks indicate statistically significant difference according to a Student’s t-test (Mann-Whitney). (E) Accumulation of T-TFs during pre-senescence (streak S1), senescence (S4), and post-senescence (S7 and S10). (F) T-TFs in mec1Δ tel1Δ, cac1Δ rtt106Δ and mec1Δ tel1Δ, cac1Δ rtt106Δ (sml1Δ background) from streak 1 biomass as determined by semiquantitative PCR. All analyses were performed with haploid strains (indicated below each genotype) obtained from heterozygous diploids and streaked for several times on rich medium plates.

