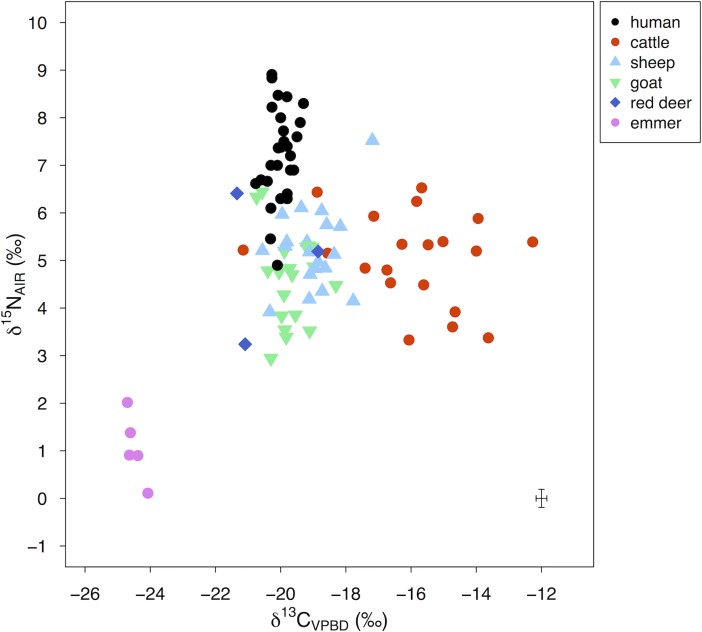
Fig 8. δ13C and δ15N values of human and domestic animal bone collagen and charred emmer grain from Makriyalos I.
Measurement error is shown in the bottom-right corner of the plot. Included are also previous measurements of contemporary human samples (n = 18) [12]. Summary statistics of three out of the five emmer grains presented in this figure have previously been published in [84].

