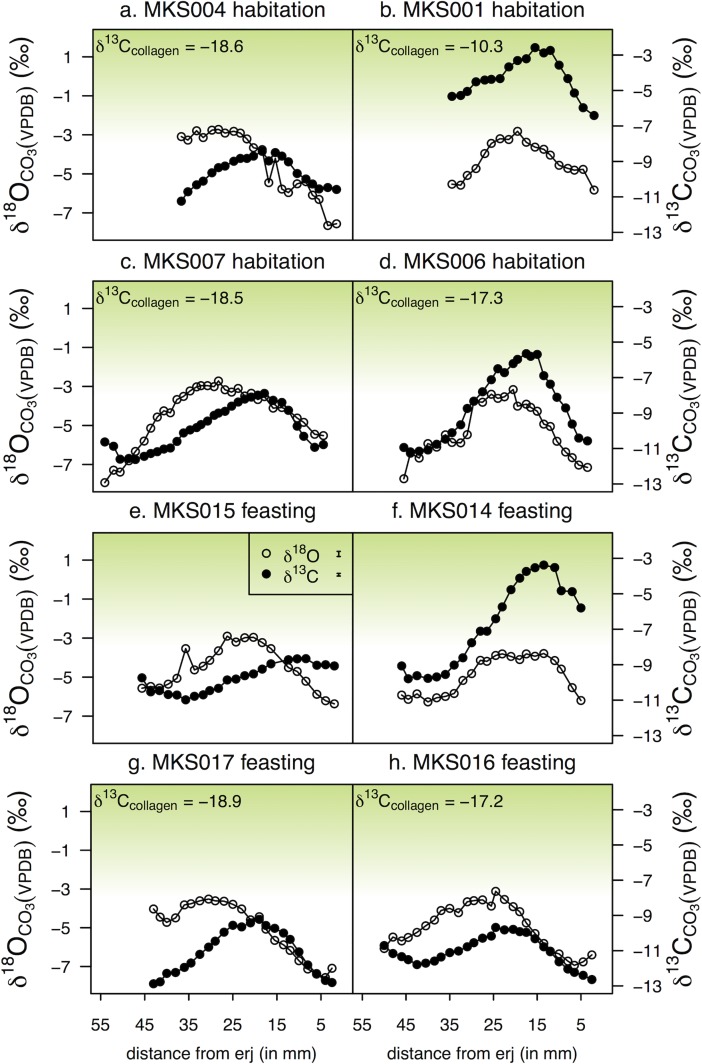
Fig 11. Incremental tooth enamel carbonate δ18O and δ13C values of cattle from Makriyalos I.
(a–d) samples from non-feasting contexts (habitation), (e–h) samples from feasting context (Pit 212). Positions of sub-samples are recorded as distance (in mm) from the enamel root junction (erj). δ13C values of matching mandibular collagen (where C/N ratio was acceptable) are included for reference. Green shading indicates theoretical values of consumers with increasing amounts of C4 vegetation in their diet (the lower endpoint is set at -8‰ [38]). Measurement error for each element is shown in the legend.

