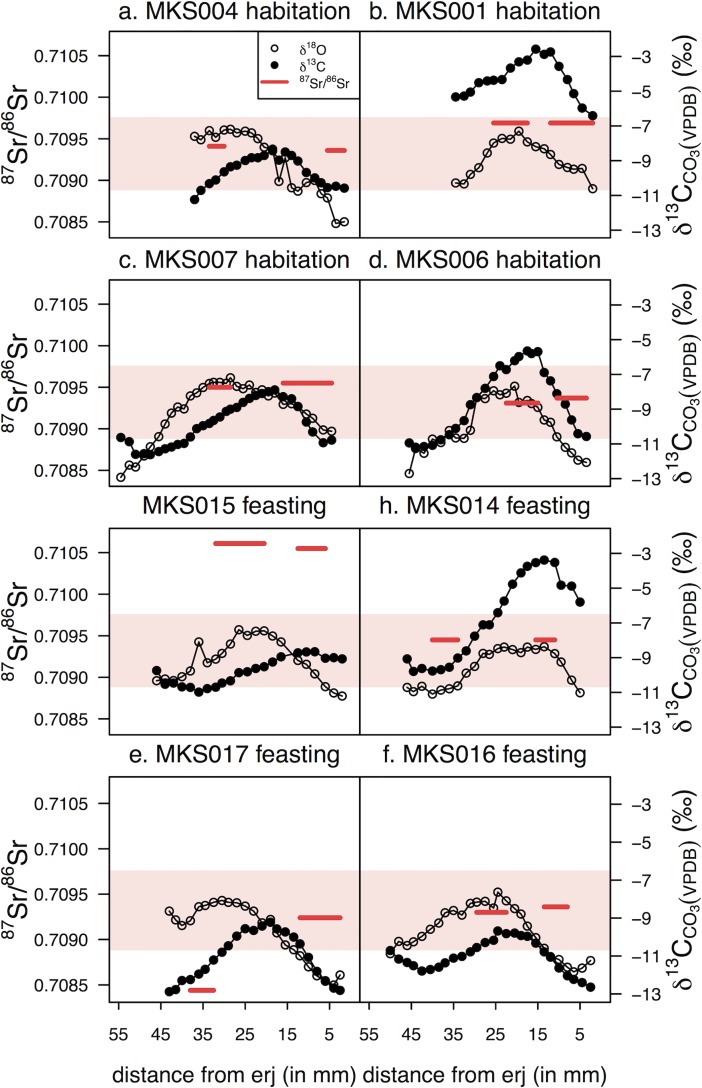
Fig 14. δ18O and δ13C values, and 87Sr/86Sr ratios for all cattle teeth analyzed in this study.
The y-axis for δ18O values is not shown, but the scale is the same as in Fig 11. The shaded region indicates the local range of Sr isotope ratios determined using measurements of modern vegetation from the local environment (see Figs 12 and 13).

