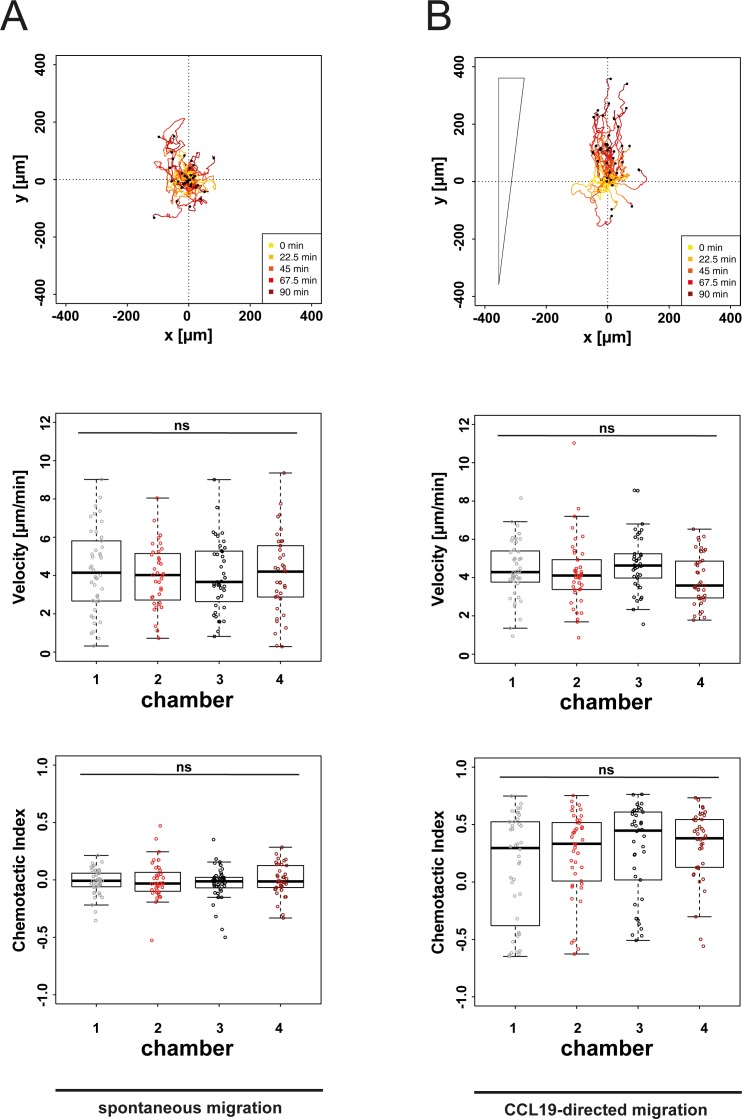
Fig 2. Reproducibility of microfluidic 3D migration assay.
(A) Analysis of spontaneous migration of DCs in 4 distinct collagen preparations (collagen concentration: 1.7 mg/mL). Cells were tracked for 90 min during culture in cell culture medium only. Panel 1 exemplarily shows migration tracks plotted to a common starting point, migration characteristics are shown in panel 2–3. Chemotactic Index is a measure for chemotactic efficiency (calculated by dividing the distance from start to end point of cells in axis of the gradient by the total migration distance of every cell). (B) DCs were tracked for 90 min during diffusion-based soluble CCL19 gradient (maximal CCL19 concentrations: 5 μg/ml). Panel 1 exemplarily shows migration tracks plotted to a common starting point, migration characteristics are shown in panel 2/3. Median and interquartile ranges shown, ρ values were calculated by Kruksal-Wallis test with Dunn’s multiple comparison test. Not significant (ns) ρ ≥ 0.05.

