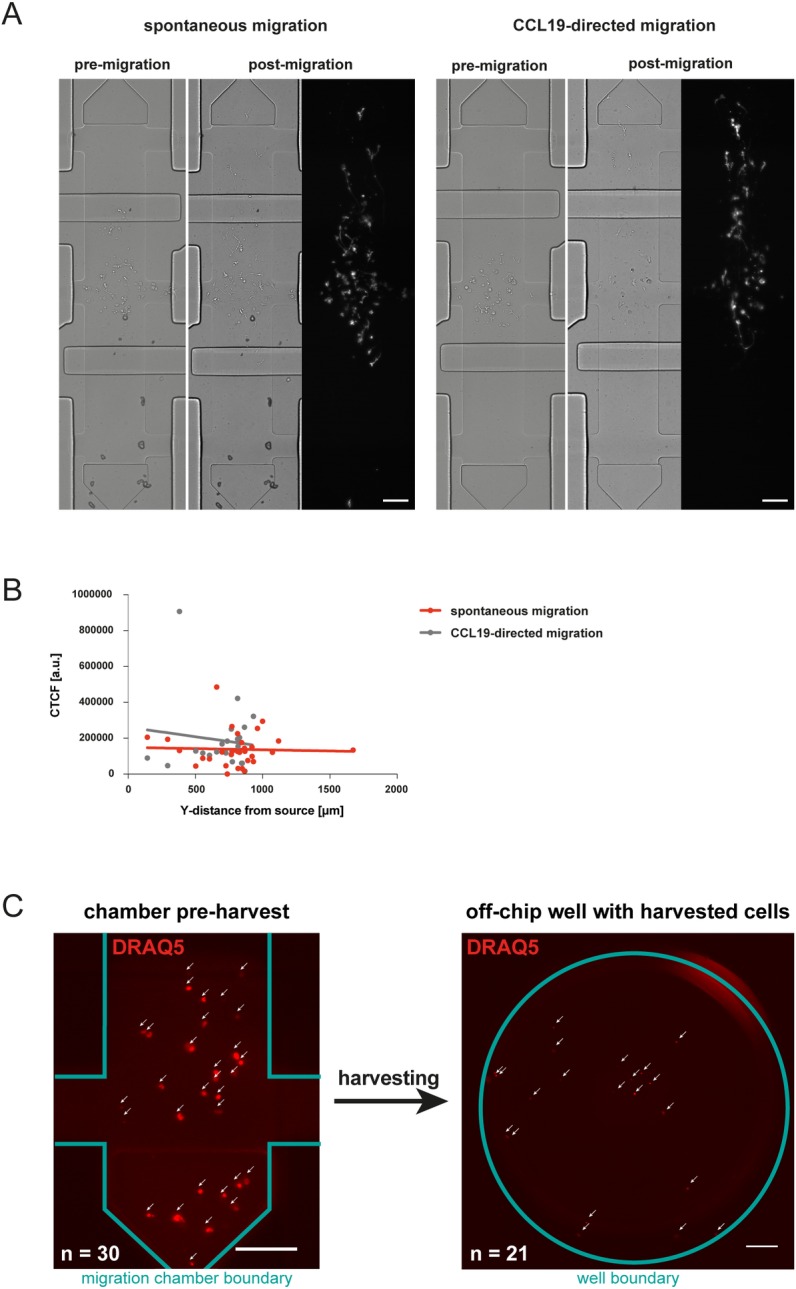
Fig 3. On-chip phenotyping and harvesting of cells.

(A) DCs were loaded localized in the middle compartment of the migration chamber in a collagen gel (1.7 mg/mL) and allowed to migrate for 2h in cell culture medium or in a soluble CCL19 gradient (5 μg/mL). Cells were stained on-chip with an anti-mouse I-A/I-E antibody. Scale bar, 100 μm. (B) Quantification of anti-I-A/I-E (MHC class II) staining of cells. Corrected Total Cell Fluorescence (CTCF) (= Integrated Density–Area of selected cell * mean fluorescence of background readings) is shown relative to Y-position in migration chamber where 0 μm indicates the chemokine source and 1700 μm the sink of the gradient system. (C) Nuclear staining of DCs with DRAQ5, cells are shown in the microfluidic chamber prior harvesting (left panel, scale bar: 100 μm) and in micro well following harvest (right panel, scale bar: 200 μm).
