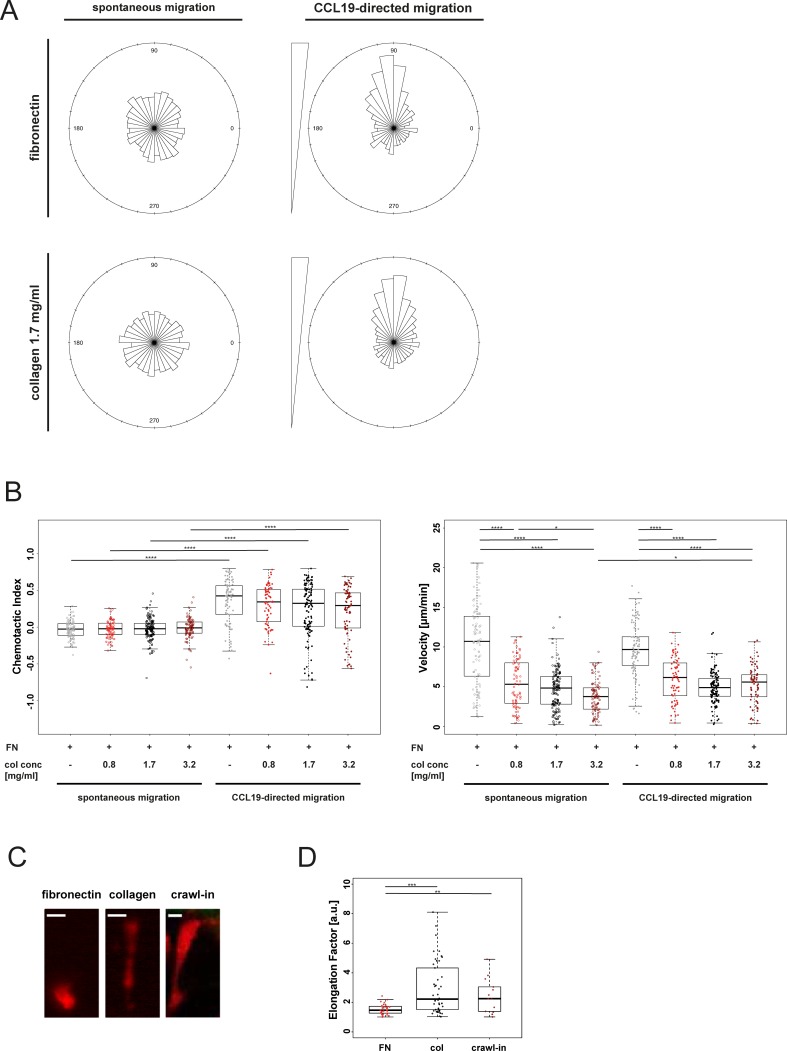
Fig 4. Quantification of microfluidic 2D and 3D migration.
(A) Distribution of migration tracks of cells migrating on fibronectin (100 μg/mL) or in a collagen gel (1.7 mg/mL). Rose plot summarizing frequency of directions relative to the starting point. (B) Quantification of migration characteristics of cells migrating on fibronectin (100 μg/mL, FN) or in a collagen gel of various densities (col conc = collagen concentration). Chemotactic Index is a measure of chemotactic efficiency (calculated by dividing the distance from start to end point of cells in axis of the gradient by the total migration distance of every cell). Median and interquartile ranges shown, ρ values were calculated by Kruksal-Wallis test with Dunn’s multiple comparison test. Not significant (ns) ρ ≥ 0.05; * ρ < 0.05; **** ρ < 0.0001. (C) Representative images of DC morphology in microfluidic 2D and 3D environments and mouse ear tissue. Scale bar, 10 μm. (D) Quantification of cell morphology of cells migrating on fibronectin (100 μg/mL), in a collagen gel (1.7 mg/mL) or in mouse ear tissue. Elongation factor = cell length divided by its perpendicular cell width. FN = fibronectin, col = collagen 1.7 mg/mL, crawl-in = mouse ear crawl-in migration assay. Median and interquartile ranges shown, ρ values were calculated by Kruksal-Wallis test with Dunn’s multiple comparison test. ** ρ < 0.01; *** ρ < 0.001.

