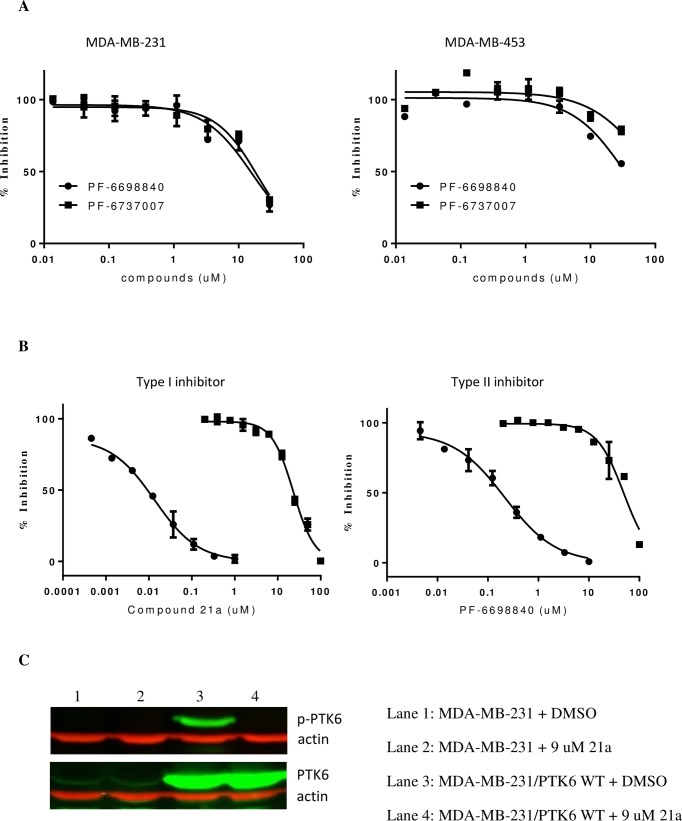
Fig 4. Inhibition of tumor cell growth by PTK6 inhibitors is independent of PTK6 kinase activity inhibition.
(A) Tumor cell growth inhibition by PTK6 inhibitor PF-6698840 (circle) and PTK6 negative control compound PF-6737007 (square) in breast tumor cell lines MDA-MB-231 and MDA-MB-453. Similar potencies were observed in the tumor growth inhibition for both compounds despite their significant difference in the potency of inhibiting PTK6 kinase activity; (B) Dose dependent inhibition of p-PTK6 kinase activity (circle) and cell proliferation (square) by Type I inhibitor 21a and Type II inhibitor PF-6698840 in engineered MDA-MB-231 cells overexpressing PTK6 WT. The p-PTK6 kinase activity was assessed by In-Cell ELISA in which cellular levels of autophosphorylation of PTK6 at Y342 were measured by fluorescence signal (OdysseyCLx imager, LI-COR Bioscience) using anti-p-PTK6 antibody and fluorescent dye–labeled detection reagents. The cell proliferation was measured by Cell Titer-Glo over the course of 6 days. The data was normalized in reference to DMSO control and expressed as percentage of inhibition at various concentrations of inhibitor in the graph. The solid lines represent a non-linear regression curve fit to a dose-response equation defined in PRISM (Graphpad Inc.); (C) Western Blot analysis of p-PTK6 and total PTK6 in the engineered MDA-MB-231 cells in the presence and absence of PTK6 inhibitor. The level of p-PTK6 in engineered MDA-MB-231 cells overexpressing PTK6 WT was diminished by 1 hour treatment of PTK6 inhibitor 21a at 37°C (upper lane 4, treated with 21a vs. upper lane 3, treated with DMSO), while total PTK6 remained unchanged (lower lane 4 treated with 21a vs. lower lane 3 treated with DMSO). Lanes 1–2 represent parental MDA-MB-231 cells, in which p-PTK6 was not detected by western blot due to low level of expression.

