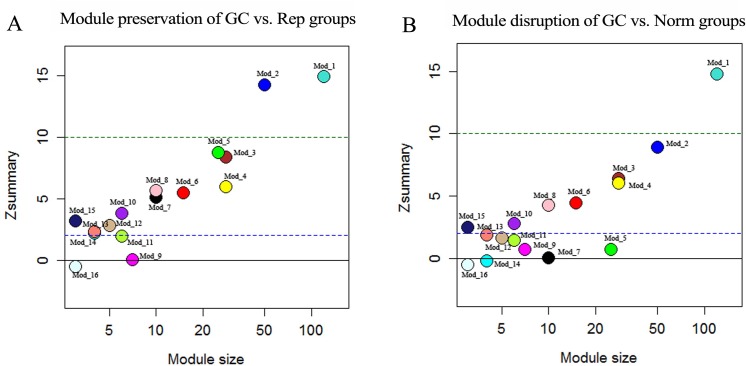
Fig 2. Zsummary-based preservation and disruption of GC modules.
A. The Zsummary preservation statistics (y-axis) of the GC modules compared with Rep group. The dashed blue and green lines (Zsummary = 2 and 10) indicate moderate and strong preservation thresholds, respectively. B. The Zsummary disruption statistics (y-axis) of the GC modules compared with Norm group. Modules with a negative Zsummary value are considered as activated modules.

