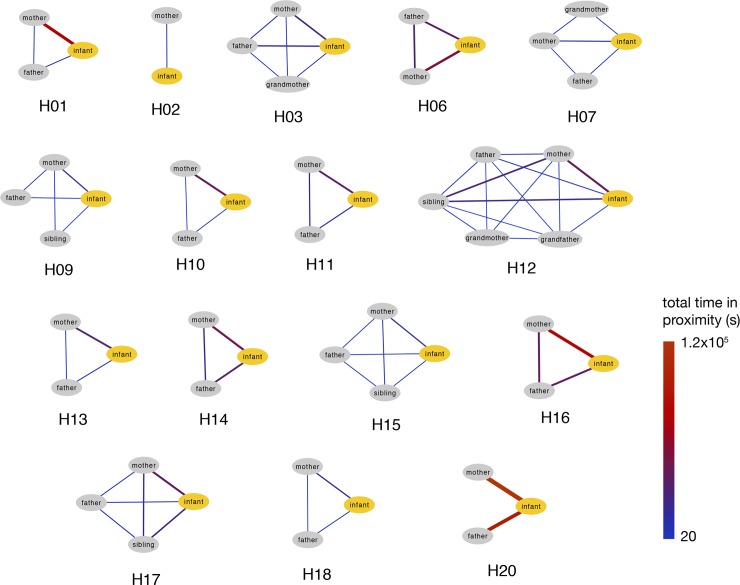
Fig 4. Contact networks between household members aggregated over the whole study duration.
Nodes are color-coded according to the role of the family member. Edge thickness is proportional to the total time spent in proximity by two connected individuals, and the edge gradient colour indicates the intensity of the contact between household members (blue = less contacts; red = more contacts).

