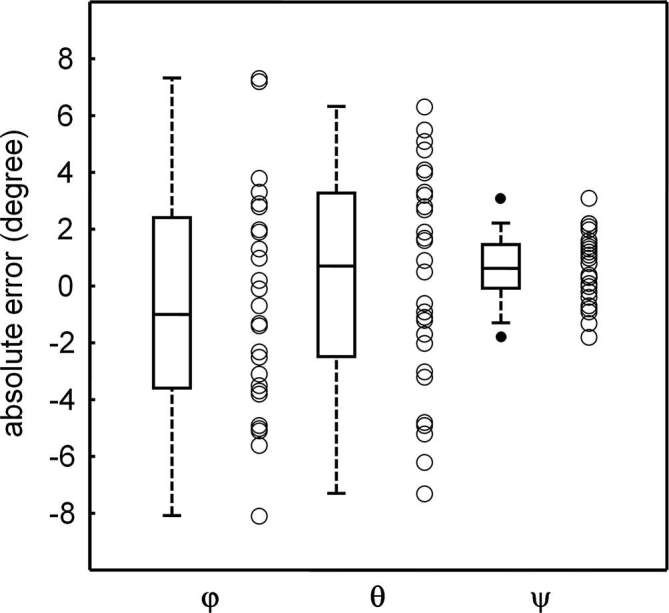
Figure 4.

Box plots representing accuracy, expressed as difference between real and virtual estimated triplets calculated from each ghost over the entire set of angular estimations obtained from real radiographs. In box-and-whiskers plot, the box line represents the lower, median and upper quartile values, the whisker lines include the rest of the data. Outliers were data with values beyond the ends of the whiskers.
